
Predicting Abalone's Age Using Machine Learning
Eko Setiawan

Summary
This project is built based on the Abalone Dataset from Kaggle for my AIBIZ certification preparation. In this project, I will try to predict the abalone shell’s age which is represented by the number of rings in the shell structure. The number of rings is presented in continuous numbers, so this project is a Regression task.
To measure how good the machine learning model is in predicting the abalone’s age, I will use a metric called Root Mean Square Error (RMSE).
Description
Data Understanding
First, let’s take a look at the data samples.

This is the first 5 rows of the data, our dependent variable in this project is Rings.

From the data, we know this dataset has 4.177 rows and 9 columns. All of the data is filled, so there is no null data.
EDA

The histogram shows the majority of abalone shell age is between 5 to 15 rings (+1.5 to get the age in years). Then there is some shell whose age is greater than 20 rings.

Male and Female shells tend to have similar ages, which means there is no significant difference in age between Sex. Therefore, the Sex variable won't be used for predicting the abalone’s ages.
Correlation

Shell_weight variable is the variable that has the highest correlation score with Rings. Because of the majority variables don’t have a very strong correlation to the label, I will use all the variables in the modeling process, except the Sex variable.
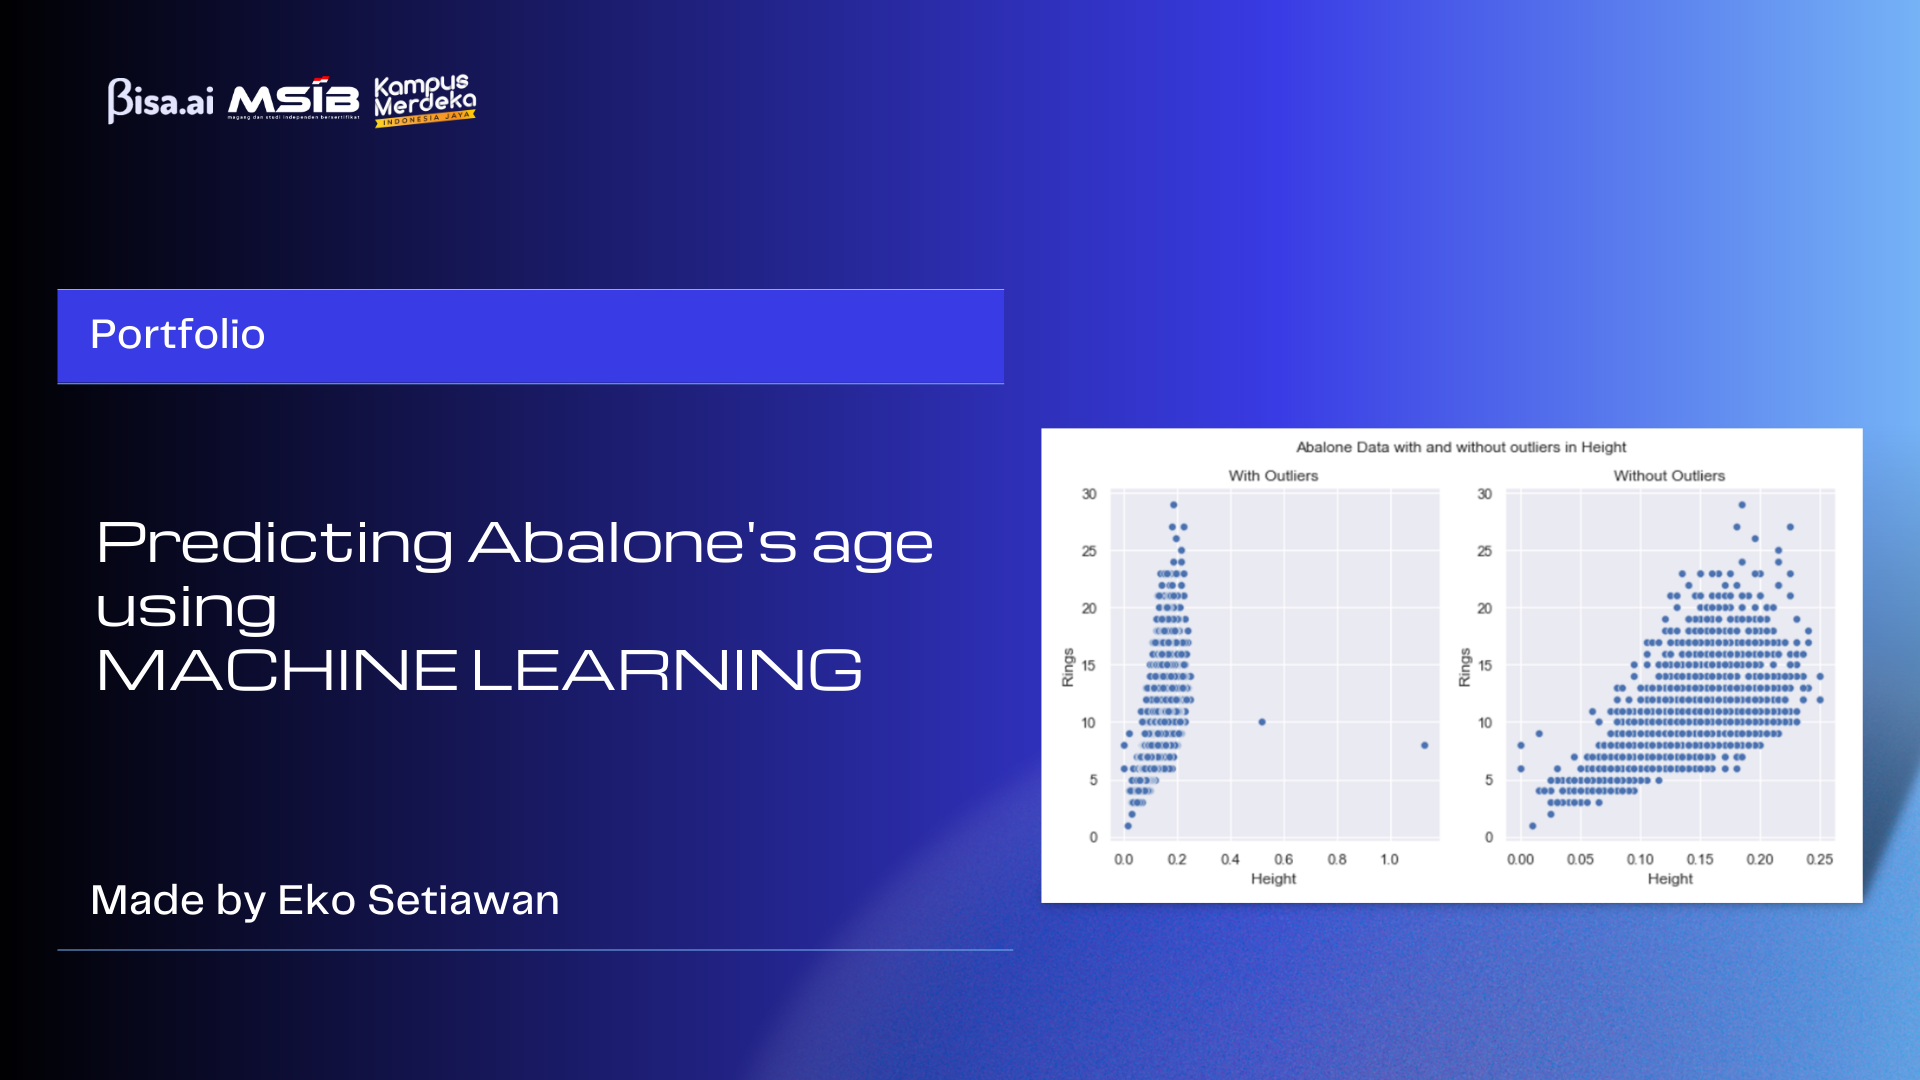
Data Cleaning

There are some data that contains outlier in their height variable. For an effective model training process, the noisy data should be removed away.
Data Splitting
To make a good model, the dataset is split into 75% for training and 25% for testing.

Data Scaling
The dataset variables have different units of measurement such as mm, gram, etc. A lot of machine learning models prefer a standardized dataset to perform its best capabilities. In this project, I use StandardScaler from Scikit-learn for data scaling or standardization. Let’s look at the dataset after standardization.

Modeling and Evaluation
Linear Regression
For the first model, I built it using the Linear Regression algorithm. In this model, we assume there is a linear relationship between our data’s features with its label. I import the model’s algorithm straight from Scikit-learn library. Let’s see how good is our first model.

After the training, the Linear Regression model gets 2.12914 for testing RMSE. This means on average, our model’s prediction and the real labels have a difference of around 2.12914 years.
Gradient Boosting Regressor
The second model that I try is built using the Gradient Boosting Regressor algorithm. It’s a tree-based model, usually tree-based model will perform better than a linear model when dealing with data that doesn’t have a strong linear relation. Let’s see how well is our gradient boosting regressor model.

After trying different model’s hyperparameters, I made a Gradient Boosting Regressor model that get 2.10948 for the testing RMSE. It performs better than linear regression.
Multi-layer Perceptron Regressor
This model is a neural network-based model called Multi-layer Perceptron Regressor. This model comes from the Scikit-Learn library. Let's see how good is my last model.

After trying a lot of models with different hyperparameter settings, the best model is a MLP model with 330 nodes on hidden layer. The best performer MLP model gets 2.01375 of RMSE score when tested with test dataset.
Conclusion
After training different models, the Multi-layer Perceptron Regressor is the best model in this project. But there is still a lot of things we can experiment in the future for a better solution. Some of things that we can try is feature extraction, try a different way of data standardization, another algorithm, different parameters setting etc.
Informasi Course Terkait
Kategori: Artificial IntelligenceCourse: Bisnis Kecerdasan Artifisial (SIB AI- Hustler)