
Vehicle Insurance Claim Fraud Detection
Trianto Haryo Nugroho


Summary
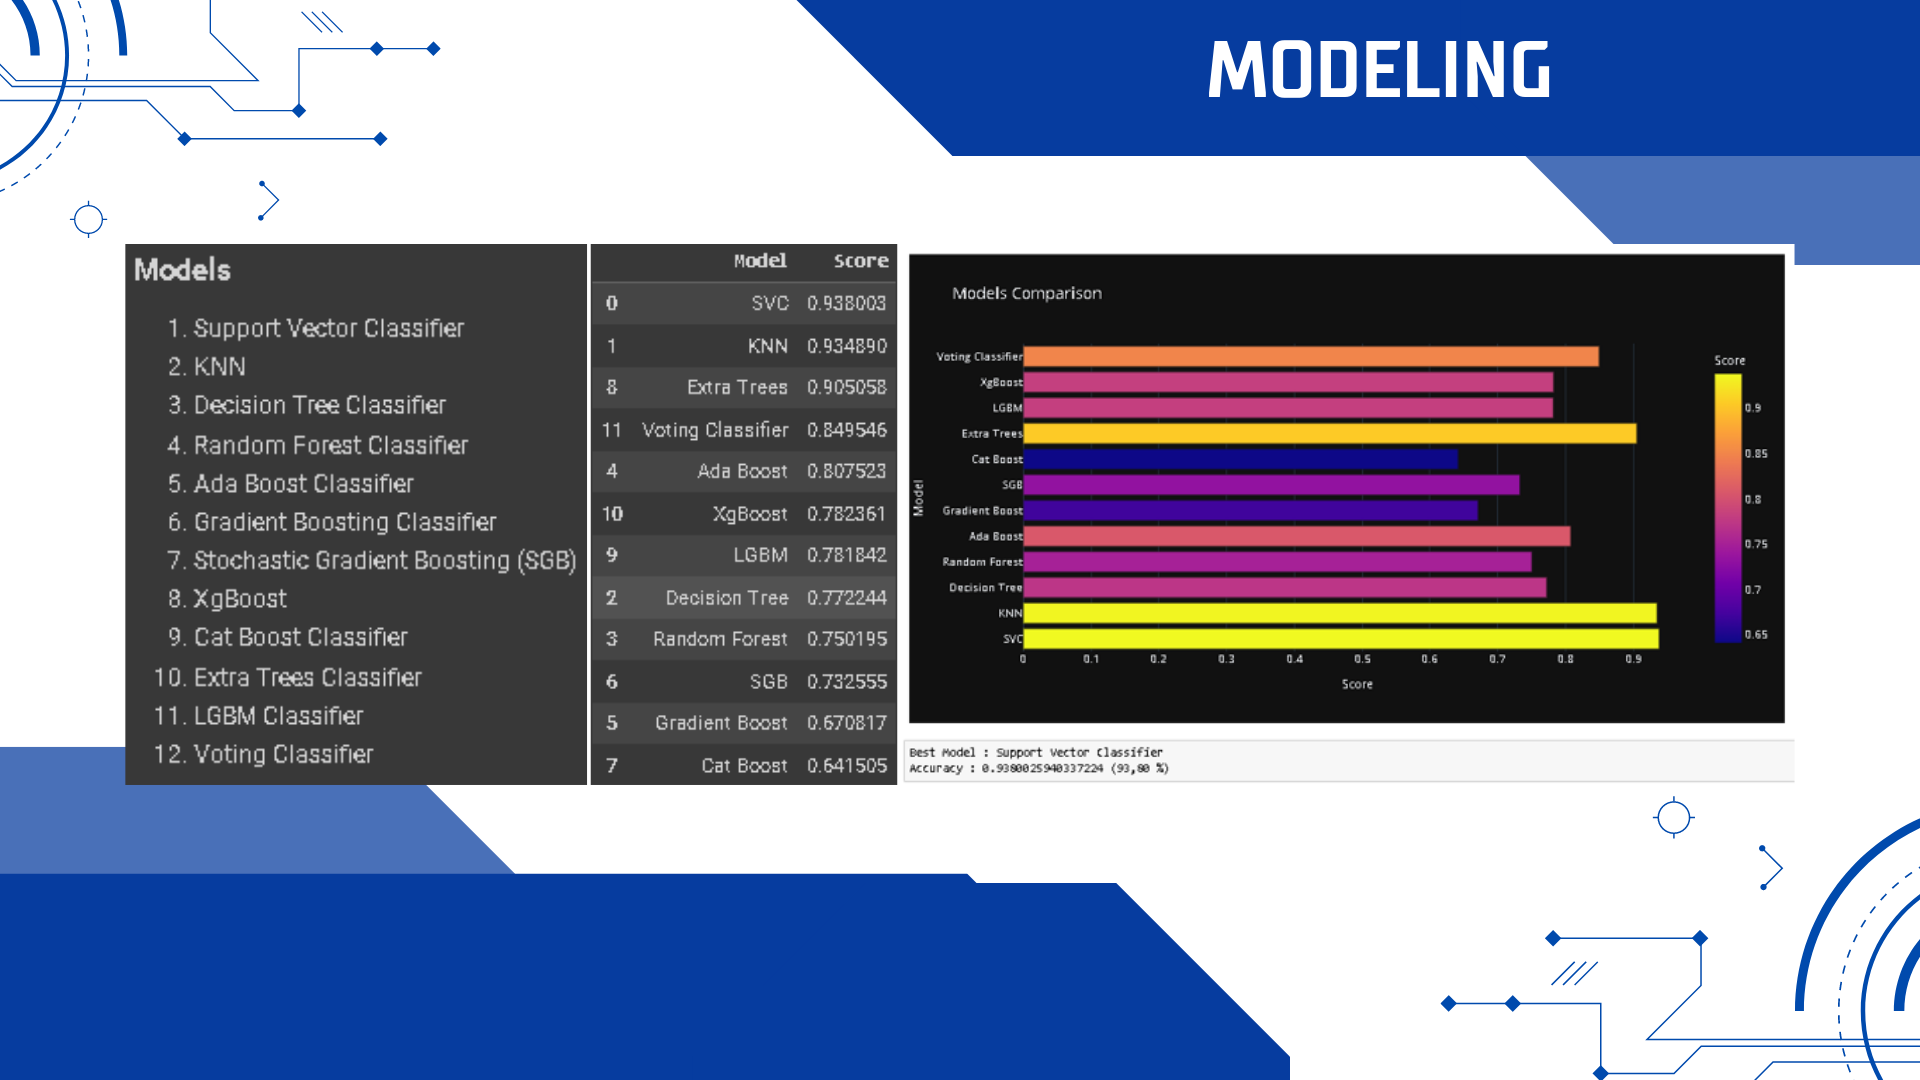
This project looks for the best model performance from 12 classification models to detect fraud in automobile insurance claims. The best model is the Ada Boost Classifier with 95.90% accuracy.
Description
Vehicle Insurance Claim Fraud Detection (Comparison 12 Models)
By: Trianto Haryo Nugroho
Data Understanding
Vehicle Insurance Fraud Detection
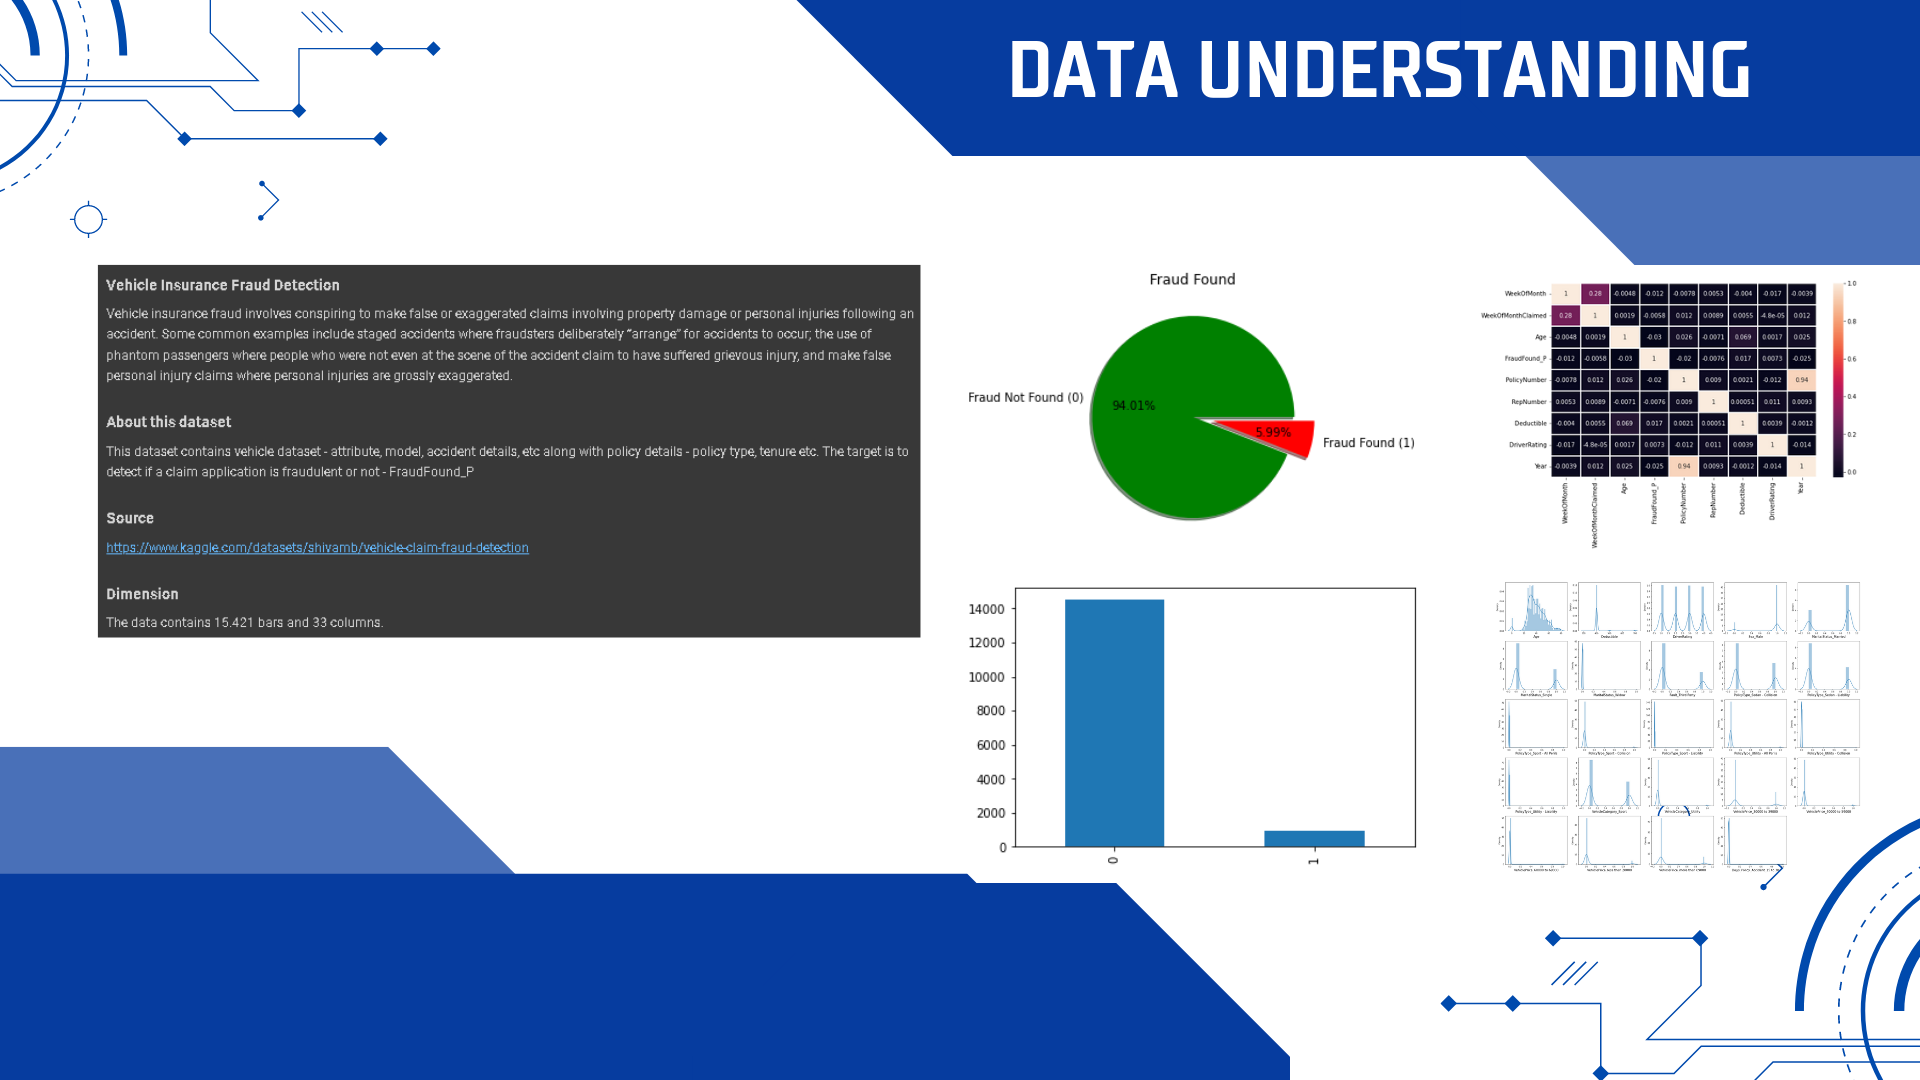
Vehicle insurance fraud involves conspiring to make false or exaggerated claims involving property damage or personal injuries following an accident. Some common examples include staged accidents where fraudsters deliberately “arrange” for accidents to occur; the use of phantom passengers where people who were not even at the scene of the accident claim to have suffered grievous injury, and make false personal injury claims where personal injuries are grossly exaggerated.
About this dataset
This dataset contains vehicle dataset - attribute, model, accident details, etc along with policy details - policy type, tenure, etc. The target is to detect if a claim application is fraudulent or not - FraudFound_P
Source
https://www.kaggle.com/datasets/shivamb/vehicle-claim-fraud-detection
Dimension
The data contains 15.421 bars and 33 columns.
Google Colab Link:
https://colab.research.google.com/drive/1o85fAtC-82uQbY1ENMWBoYZGoszUjwiE?usp=sharing
Exploratory Data Analysis (EDA)
Import Library

Upload Dataset

Read Dataset

Display 5 Samples

Dataset Information

The dataset consists of 15.421 rows and 33 columns columns
Checking Missing Values

There is no missing value in the dataset
Checking Data Duplicates

There is no duplicate data in the dataset
Checking Shape or Dimension

Checking Label Proportion


Significant differences in the proportion of labels in the classification case can cause computers/machines to not learn well so that the model formed can only recognize dominant labels.
There is a significant difference in the proportion of labels in this dataset so later we will balance the dataset.
Descriptive Statistics

Histogram


The highest age is between 30-40 years old. The highest Fraud_Found_P is 0. The highest deductible is between 400. There were no significant differences between driver ratings.


Pair Plot


Correlation


Checking for Multicollinearity


From the above plot, we can see there is only a low correlation between features, we don't need to remove it.
Checking Number of Unique Values

Remove Unnecessary Columns


Data Preprocessing
Separating the feature and target columns

Encoding Categorical Columns
Seeing the percentage distribution of categorical data, if there is one value that dominates the feature, it will be discarded.


Extracting Categorical Columns

Printing Unique Values of Each Column


Get Dummies from Categorical Columns

Extracting the Numerical Columns

Combining Numerical and Categorical Columns


The data looks good, let's check for outliers.
Outliers Detection


Outliers are present in some numerical columns we will scale numerical columns later.
Split Dataset


Normalization


Balancing the Dataset using oversampling (SMOTE)


Reduce Overfitting using Principal Component Analysis (PCA)


Modeling

1. Support Vector Classifier
Fit the model

Model Evaluation

2. KNN
Fit the model

Model Evaluation

3. Decision Tree Classifier
Fit the model

Model Evaluation

Hyperparameter tuning

Print best parameters and the best score

Fit the best estimator

Model Evaluation

4. Random Forest Classifier
Fit the model

Model Evaluation

5. Ada Boost Classifier
Fit the model using hyperparameter tuning

Print the best parameters and the best score

Fit the best estimator

Model Evaluation

6. Gradient Boosting Classifier

7. Stochastic Gradient Boosting (SGB)
Fit the model and model evaluation

8. XGBoost Classifier
Fit the model

Model Evaluation

Hyperparameter tuning

Model Evaluation after Hyperparameter tuning

9. Cat Boost Classifier
Install Cat Boost

Fit the model

Model Evaluation

10. Extra Trees Classifier
Fit the model and model evaluation

11. LGBM Classifier
Fit the model and model evaluation

12. Voting Classifier
Fit the model

Model Evaluation

Model Performance Comparison


Model Performance Comparison Visualization


Conclusion
Best Model : Ada Boost Classifier
Accuracy : 0.958958 (95,90 %)
Informasi Course Terkait
Kategori: Data Science / Big DataCourse: Data Science


