Heart Failure Prediction-Random Forest Classifier
Trianto Haryo Nugroho
Summary
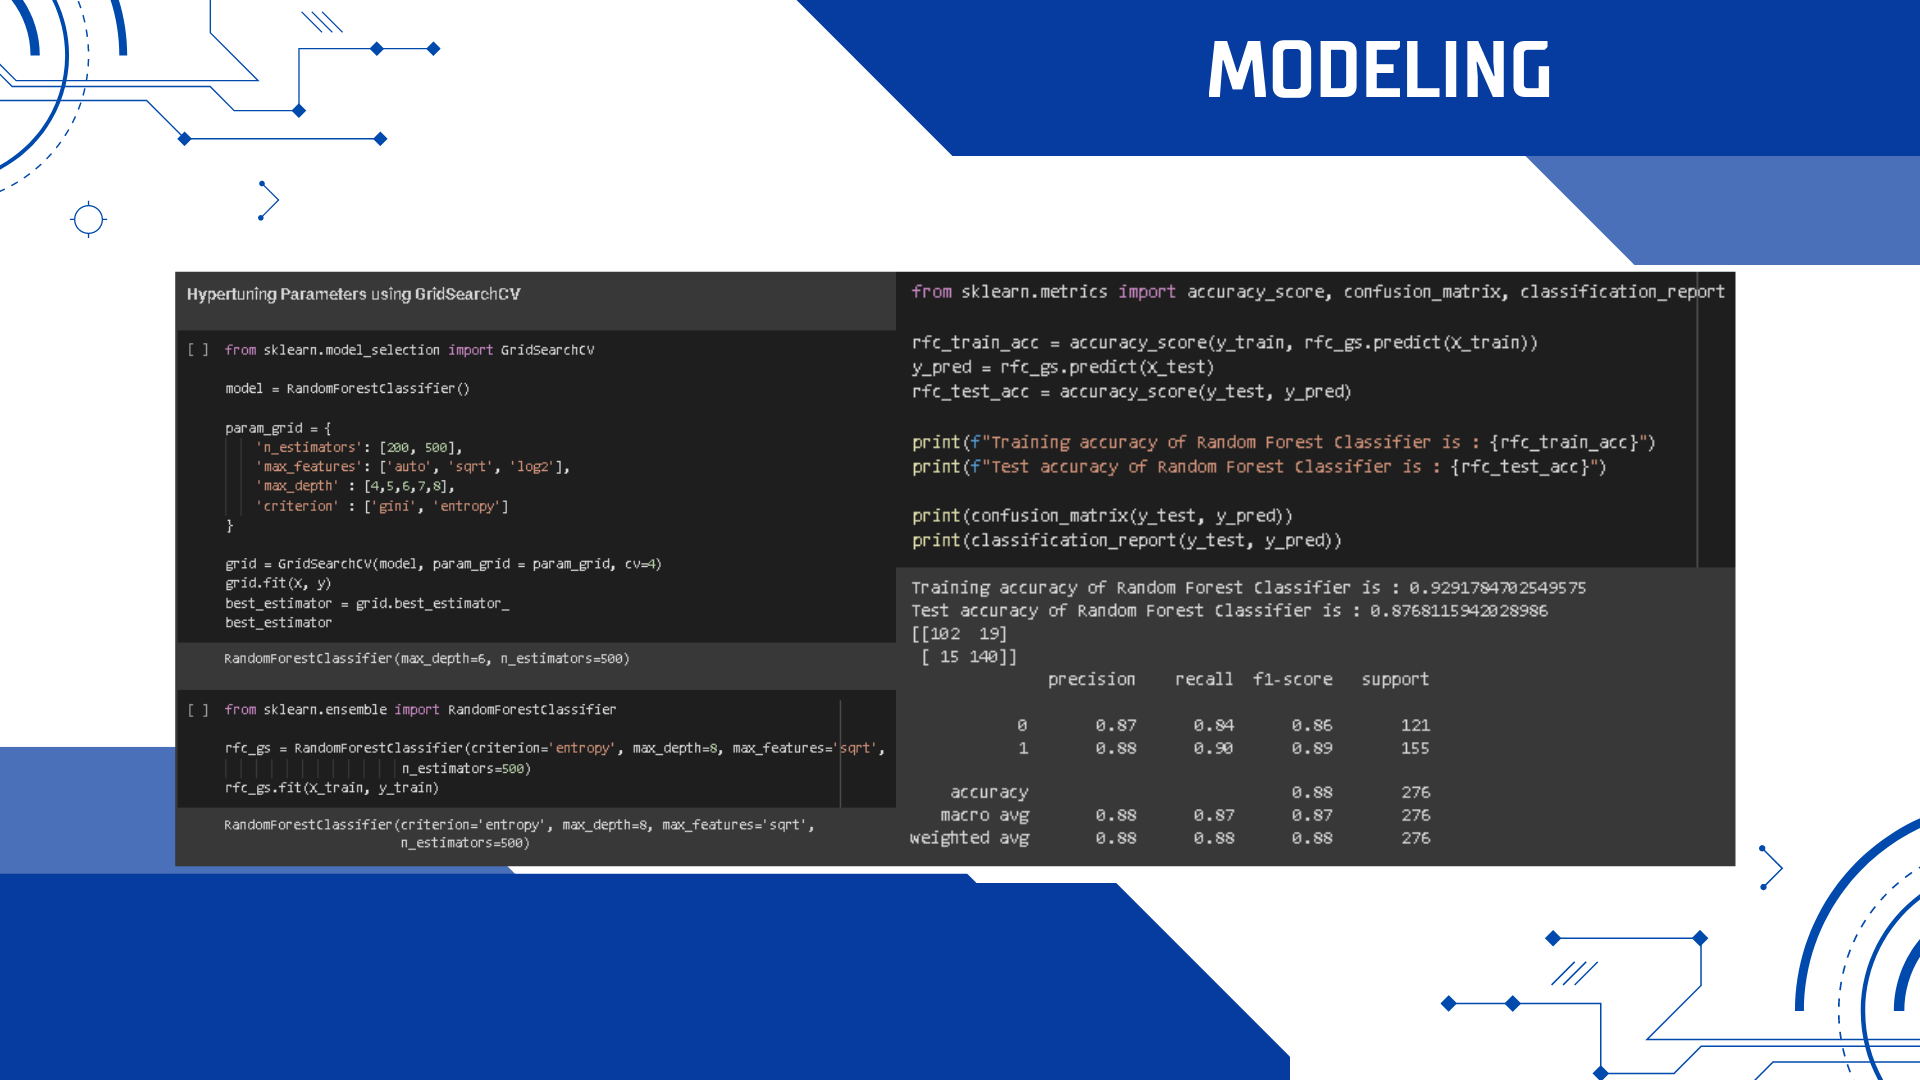
This project predicts whether a person has heart disease or not using a Random Forest Classifier model that uses Hypertuning Parameters with GridSearchCV to get the best model performance with an accuracy of 88.04%.
Description
Heart Failure Prediction using Random Forest Classifier
By: Trianto Haryo Nugroho
Data Understanding
Context
Cardiovascular diseases (CVDs)are the number 1 cause of death globally, taking an estimated 17.9 million lives each year, which accounts for 31% of all deaths worldwide. Four out of 5CVD deaths are due to heart attacks and strokes, and one-third of these deaths occur prematurely in people under 70 years of age. Heart failure is a common event caused by CVDs and this dataset contains 11 features that can be used to predict possible heart disease.
People with cardiovascular disease or who are at high cardiovascular risk (due to the presence of one or more risk factors such as hypertension, diabetes, hyperlipidemia, or already established disease) need early detection and management wherein a machine learning model can be of great help.
Attribute Information
- Age: age of the patient [years]
- Sex: sex of the patient [M: Male, F: Female]
- ChestPainType: chest pain type [TA: Typical Angina, ATA: Atypical Angina, NAP: Non-AnginalPain, ASY: Asymptomatic]
- RestingBP: resting blood pressure[mm Hg]
- Cholesterol: serum cholesterol [mm/dl]
- FastingBS: fasting blood sugar [1: if FastingBS > 120 mg/dl,0: otherwise]
- RestingECG: resting electrocardiogram results [Normal: Normal, ST: having ST-T wave abnormality (T wave inversions and/or elevation or depression of > 0.05 mV), LVH: showing probable or definite left ventricular hypertrophy by Estes' criteria]
- MaxHR: maximum heart rate achieved[Numeric value between60 and 202]
- ExerciseAngina: exercise-induced angina [Y: Yes, N: No]
- Oldpeak: oldpeak= ST [Numeric value measured in depression]
- ST_Slope: the slope of the peak exercise ST segment [Up: upsloping, Flat: flat, Down: down sloping]
- HeartDisease: output class [1: heart disease, 0: Normal]
Source
This dataset was created by combining different datasets already available independently but not combined before. In this dataset, 5 heart datasets are combined over 11 common features which makes it the largest heart disease dataset available so far for research purposes. The five datasets used for its curation are:
Cleveland: 303 observations Hungarian: 294 observations Switzerland: 123 observations Long Beach VA: 200 observations Stalog (Heart) Data Set: 270 observations Total:1190 observations Duplicated: 272 observations.
Final dataset: 918 observations.
Every dataset used can be found under the Index of heart disease datasets from UCI Machine Learning Repository on the following link: https://archive.ics.uci.edu/ml/machine-learning-databases/heart-disease/
Citation
fedesoriano. (September 2021). Heart Failure Prediction Dataset. Retrieved [Date Retrieved] from:
https://www.kaggle.com/fedesoriano/heart-failure-prediction.
Dimension
The data contains 918 bars and 12 columns.
Google Colab Link:
https://colab.research.google.com/drive/1MOhT_UBofCD1Y0SU1BadkGYfXhtjwJl7?usp=sharing
Exploratory Data Analysis (EDA)
Import Library
Upload Dataset
Read Dataset
Display 5 Samples
Dataset Information
Checking Shape
The dataset consists of 918 rows and 12 columns
Checking Missing Values
There is no missing value in the dataset.
Checking Data Duplicates
There is no duplicate data in the dataset.
Checking Label Proportion
Significant differences in the proportion of labels in the classification case can cause computers/machines to not learn well so that the model formed can only recognize dominant labels. There is a significant difference in the proportion of labels in this dataset so we will balance it later.
Descriptive Statistics
Histogram
Data is not normally distributed.
Most people who experience heart failure are aged 55-65 years old and those who do not experience heart failure are aged 40-55 years old.
Pair Plot
There is a negative correlation between MaxHR and Age but not too big.
Correlation
The highest correlation is between HeartDisease and Oldpeak HeartDisease and HeartDisease and MaxHR.
Checking for Multicollinearity
From the above plot, we can see there is only a low correlation between features, we don't need to remove it.
Data Exploration
Age
Descriptive Statistics
Data Proportion
Unique Values
Number of Unique Values
Count of Age Bar Chart
From the figure above, it can be seen that the highest value of the count of Age is 54 years old and the lowest are 28, 30, and 73 years old. The large stage is dominated by the aged 51-63 years old.
Age vs HeartDisease Bar Chart
The highest who have HeartDisease of 1 is 58 years old and those who have HeartDisease of 0 are 54 years old.
From the figure above, it can be seen that most people who had age 58 years old were more had HeartDisease and those who had aged 54-63 years old greater chance of developing HeartDisease. Most people who had aged 54 years old were more normal.
Distribution Plot
Data is not normally distributed but has positive skewness.
Checking Outliers with Boxplot
There are no outliers in Age.
There were no outliers for Age with HeartDisease of 0 and 1.
We do the same data exploration for other features. For more details, see the Google Colab notebook.
Checking Outliers of All Columns
Handling Outliers
Checking Outliers after Handling Outliers
Data Preprocessing
Checking Number of Unique Values of Categoricals Features
There is no single value that dominates the categorical data.
Data Transformation
Normalization
MinMaxScaler()
Checking data distribution before normalization.
Normalization
Checking Data Distribution after Normalization.
Merge the transformed columns
Train-Test Split
Balancing (SMOTE Oversampling)
Principal Component Analysis (PCA)
To reduce overfitting, we do the Principal Component Analysis (PCA).
Modeling
Using Random Forest Classifier for Modeling.
Checking Feature Importance
Model Evaluation
Feature Selection
Choose columns with feature importance > 0.02
Feature selection makes model performance decrease, so we don't use feature selection and continue using hypertuning parameters (GridSearchCV) to improve model performance.
Hypertuning Parameters Using GridSearchCV
Model performance improves after Hypertuning Parameters Using GridSearchCV.
Informasi Course Terkait
Kategori: Data Science / Big DataCourse: Python Data Science untuk Pemula


