
Abalone Age Prediction: A Linear Regression
Virdha Rahma Aulia
Summary
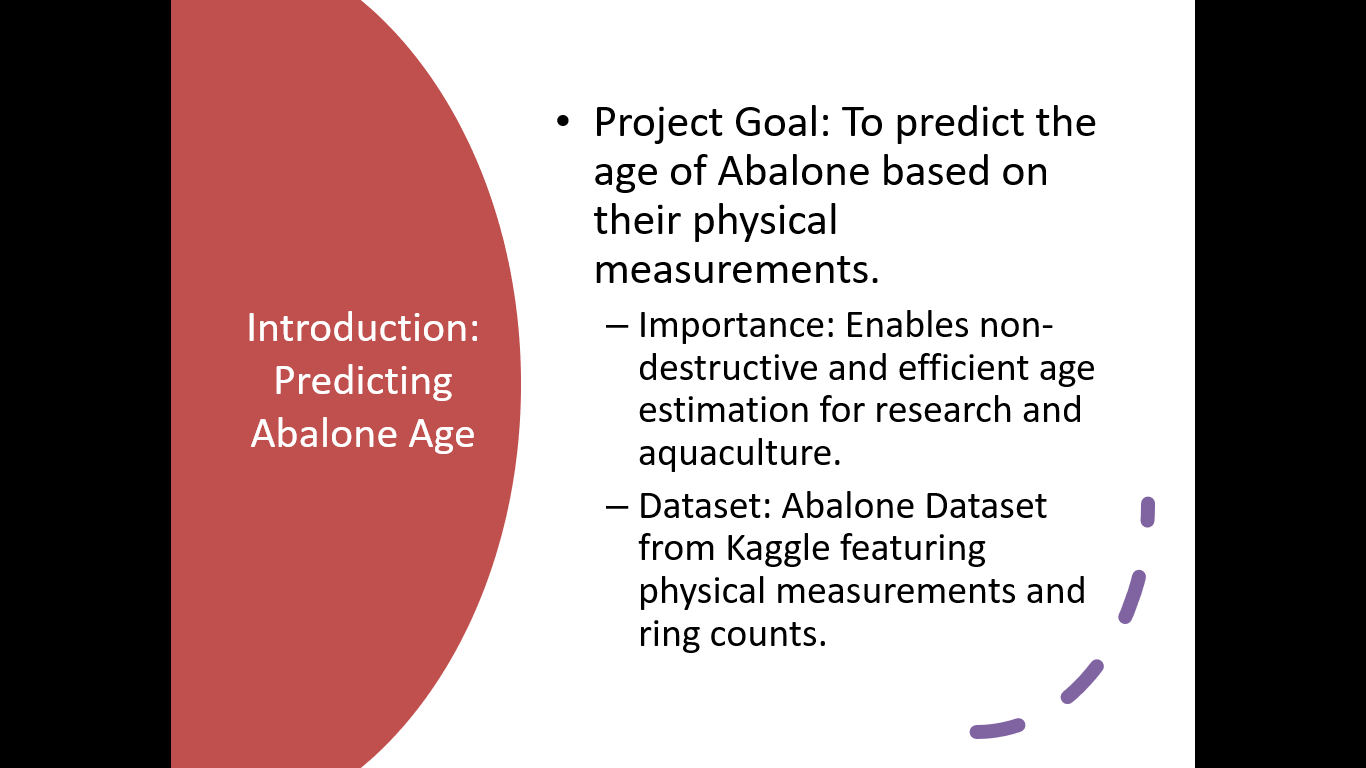
•Project Goal: To predict the age of Abalone based on their physical measurements.
–Importance: Enables non-destructive and efficient age estimation for research and aquaculture.
–Dataset: Abalone Dataset from Kaggle featuring physical measurements and ring counts.
•Objective: Model linear relationships between measurements and rings.
–Model: sklearn.linear_model.LinearRegression
–Dependent Variable: Rings
–Independent Variables: Length, Diameter, Height, Whole weight, Shucked weight, Viscera weight, Shell weight
Description
Abalone Age Prediction: A Linear Regression Approach
1. Introduction: Predicting Abalone Age
- Project Goal: To predict the age of Abalone based on their physical measurements.
- Why is this important?
- Abalone age is typically determined by cutting the shell and counting rings, a time-consuming and destructive process.
- Predicting age from physical characteristics can streamline research, conservation efforts, and aquaculture practices.
- Dataset:
- Abalone Dataset (sourced from Kaggle)
- Contains physical measurements and the number of rings (age).
2. Data Overview
- Dataset Dimensions: 4177 entries (observations)
- Features: 9 columns in total.
- Sex: Categorical (M, F, I for Infant)
- Length, Diameter, Height: Physical dimensions (float64)
- Whole weight, Shucked weight, Viscera weight, Shell weight: Various weight measurements (float64)
- Rings: Target variable (int64) - This represents the age (+1.5 to get actual age).
Sample Data (df.head())

Statistical Summary (df.describe())
- Length: Mean ~0.52, min 0.075, max 0.815
- Diameter: Mean ~0.40, min 0.055, max 0.650
- Height: Mean ~0.13, min 0.000 (potential outliers/errors), max 1.130
- Weights (Whole, Shucked, Viscera, Shell): Show varying ranges and distributions.
- Rings: Mean ~9.93, min 1, max 29.
3. Methodology: Linear Regression
- Objective: To model the linear relationship between physical measurements (independent variables) and the number of rings (dependent variable).
- Model Used: sklearn.linear_model.LinearRegression
- Dependent Variable (Y): Rings
- Independent Variables (X):
- Length
- Diameter
- Height
- Whole weight
- Shucked weight
- Viscera weight
- Shell weight
4. Model Training and Evaluation
- Data Split: The dataset was split into training and testing sets to evaluate model performance on unseen data.
- test_size = 0.2 (20% for testing)
- random_state = 42 (for reproducibility)
- Metrics Used:
- R-squared (R2): Measures the proportion of the variance in the dependent variable that is predictable from the independent variables. Higher is better (closer to 1).
- Mean Squared Error (MSE): Measures the average of the squares of the errors—that is, the average squared difference between the estimated values and the actual value. Lower is better.
Linear Regression Model Results:
R-squared (R2): 0.5330
Mean Squared Error (MSE): 5.8555
- Interpretation:
- The R-squared value of 0.5330 indicates that approximately 53.3% of the variance in the number of Rings can be explained by the selected physical measurements.
- The MSE of 5.8555 represents the average squared difference between our model's predictions and the actual number of rings.
5. Visualizing Predictions and Residuals
Actual vs. Predicted Rings
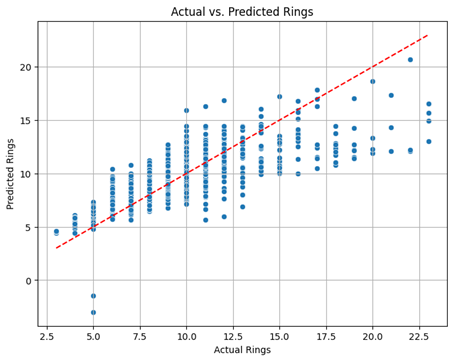
- Description: This scatter plot compares the actual number of rings to the number of rings predicted by the model. The red dashed line represents perfect predictions (where Actual = Predicted).
- Observation: While there's a general positive correlation, the points are scattered around the line, indicating the model has room for improvement in accurately predicting individual abalone ages.
Residuals Distribution
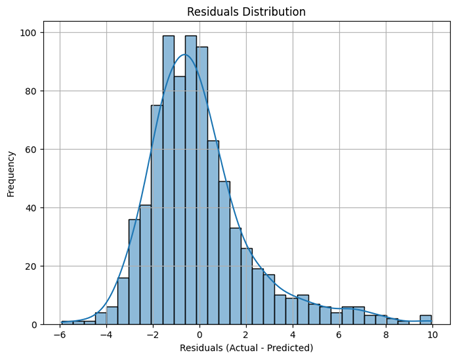
- Description: This histogram shows the distribution of the residuals (Actual Rings - Predicted Rings). Ideally, residuals should be normally distributed around zero.
- Observation: The distribution is somewhat bell-shaped but appears slightly skewed, suggesting some patterns in the errors that the linear model might not fully capture.
6. OLS Regression Summary (Detailed Insights)

Notes:
[1] Standard Errors assume that the covariance matrix of the errors is correctly specified.
Key Takeaways from OLS Summary:
- R-squared (0.526): Consistent with the scikit-learn result, indicating a moderate fit.
- P-values:
- Diameter, Height, Whole weight, Shucked weight, Viscera weight, and Shell weight all have very low p-values (0.000), suggesting they are statistically significant predictors of Rings.
- Length: Has a high p-value (0.467), indicating it might not be a statistically significant predictor in this model given the presence of other variables.
- Coefficients:
- Positive coefficients (e.g., Diameter, Height, Whole weight, Shell weight) suggest that as these increase, Rings tend to increase.
- Negative coefficients (e.g., Length, Shucked weight, Viscera weight) suggest an inverse relationship. The negative coefficients for Shucked weight and Viscera weight are particularly strong, which can sometimes indicate multicollinearity or complex interactions not fully captured by a simple linear model.
7. Conclusion
- The Linear Regression model successfully captures a moderate portion of the variance in Abalone age (R-squared ~0.53).
- Most physical measurements (Diameter, Height, various weights) are statistically significant predictors.
- The model provides a non-destructive method for estimating abalone age, which can be valuable for practical applications.
8. Future Work & Improvements
- Feature Engineering:
- Explore creating new features (e.g., ratios of weights/dimensions) that might better capture the underlying relationships.
- Address the categorical Sex variable by one-hot encoding or other appropriate methods.
- Model Selection:
- Experiment with other regression algorithms (e.g., Random Forest Regressor, Gradient Boosting Regressor, Ridge/Lasso Regression) that might capture non-linear relationships or handle multicollinearity better.
- Outlier Treatment: Investigate and handle outliers, especially in Height (min 0.000) and potentially other weight measurements, which could be affecting model performance.
- Error Analysis: Deeper analysis of residuals to understand systematic errors and areas where the model performs poorly.
Informasi Course Terkait
Kategori: Algoritma dan PemrogramanCourse: Persiapan Ujian Sertifikasi Internasional DSBIZ - AIBIZ


