
EDA Climate Data BMKG DKI JAKARTA 1995-2022
Bagja Lazwardi

Summary
In this project, I did an EDA (Exploratory Data Analist ) And to make a Rainfall prediction model from Air Humidity from the climate data of the BMKG of Jakarta Province in 1995-2022, the data obtained from https://dataonline.bmkg.go.id with 3 different stations, among others.
Kemayoran meteorological station, Tanjung Priuk meteorological station, and Halim meteorological station.
Description
Information:
Wind direction when maximum speed (ddd_x)
Most wind direction (ddd_car)
Rainfall (RR)
Maximum wind speed (ff_x)
Average wind speed (ff_avg)
Average humidity (RH_avg)
Duration of solar irradiation (ss)
Maximum temperature (Tx)
Minimum temperature (Mr)
Average temperature (Tavg)
- EDA
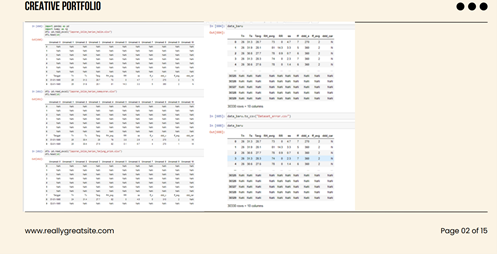
In this project I will clean up 3 data from different stations and delete columns that are not needed because the data that can be in can still be messy data. Data cleansing here by removing the empty top column, renaming the column , Checking the Misinng Value in each of the data just now.


After the data is neat, the data is assembled into one data using the concat function in the Pandas library.

After the data is merged into one data, it is checked for types to find out what types of data are in the dataset.

All column data types of objects in which objects are a collection of different types of data types.

Here we will change the object's data type to Float in order to make the model no obstacles. And we will look at the statistics from the data as follows:

We check the missing value and fill in the blank values to be evenly distributed from each column and look at the differences from the data we researched.

2. Visualization
Using the matplotlib library we can see that the correlation between columns and for precipitation with humidity has a correlation of 0.34.

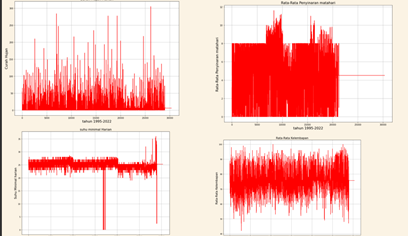
From the data that has been compiled and combined earlier, here is a Plot of Rainfall, Minimum Temperature, Maximal Temperature, average humidity, average solar irradiation from 1995-2022


And from the average irradiation chart, there is blank data from 2019-2022, which is from that data, which is not recorded climate data.
3. Create a Regression Prediction Model lInier
The model that will be made is Linear Regrresi in line with Y is rainfall and X is Humidity.

After we divide the train test data, from the resulting model, it is as follows with the Intercept Coefficient is -53.541 and Koef X is 0.78
And here is the actual data table data and prediction data

Here's the .plot scater of the predictions produced

Informasi Course Terkait
Kategori: Data Science / Big DataCourse: Python Data Science untuk Pemula
