
Telco Churn Prediction using Logistic Regression
Evaristus Seto Bayu Nugroho

Summary
This project will show how to doing Exploratory Data Analysis using Python. I using telco dataset which i get on the kaggle. This project want to search what is the correlation between churn (dependent variable) and other variables (independent variable)
Description
Problem:
Churn is the number of customers that don't return to your company after making a purchase. When it occurs, the company’s revenue will decrease. When talking about revenue, we also talk about cost. There are promotional costs known as Acquisition Cost and Retention Cost. According to outboundengine.com, acquiring a new customer can cost five times more than retaining an existing customer. Also, increasing customer retention by 5% can increase profits from 25-95%. In other words, it is better to prevent the churn than acquire new customers.
Churn occurs in many industries including Telco industry. A high rate of churn will harm the business in the long term. Therefore, it is important to identify the customers who will churn so that the telco company can take action to prevent that. Due to human limitations in analyzing and predicting large amounts of data, machine learning is needed to predict the churn problem. Predicting churn using machine learning also capable to help the company to allocate the cost as precise as possible.
The company could reach the customers for communication and ask for feedback or even give discount, bundling campaigns, or other incentives to prevent them from churning. Knowing which customers who will churn could reduce the number of customers to be given the promo and later it will reduce the churn rate.
Goal: Predict customers who will churn
Action: Reach the customers who are predicted to Churn to them treatments such as communicate and ask for feedback as well as give incentives (discount, bundling package etc.)
Value: Allocate the cost as precise as possible
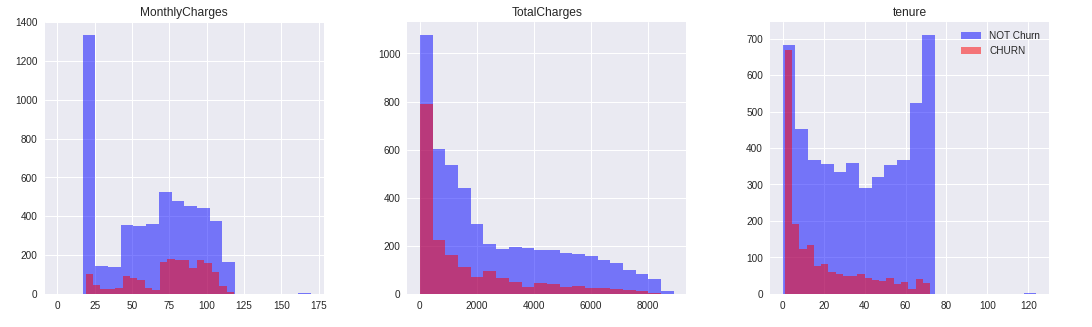
Distribution of Telco Churn on Numeric Variable
At this stage, what will be done is to choose a predictor variable that is numerical in nature and make a bivariate plot, then interpret it. Based on the dataset information that has been displayed, there are three numerical variables, namely MonthlyCharges, TotalCharges, and tenure.

Summary :
- For MonthlyCharges feature, there is a tendency that the smaller the value of the monthly fees charged, the smaller the tendency to do Churn.
- For TotalCharges there doesn't seem to be any inclination towards Churn customers.
- For tenure, there is a tendency that the longer the customer subscribes, the less likely it is to churn.
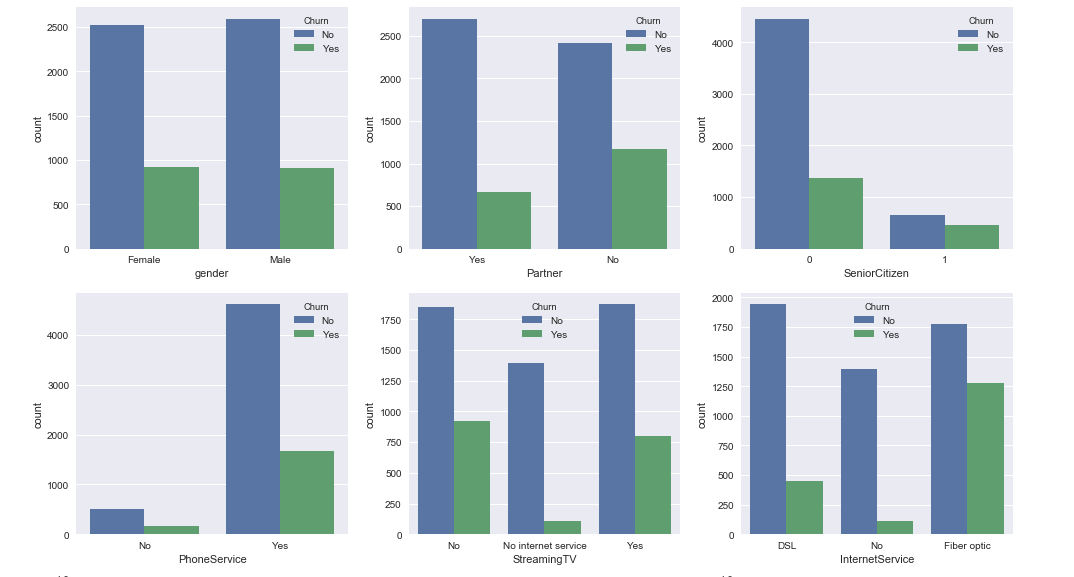
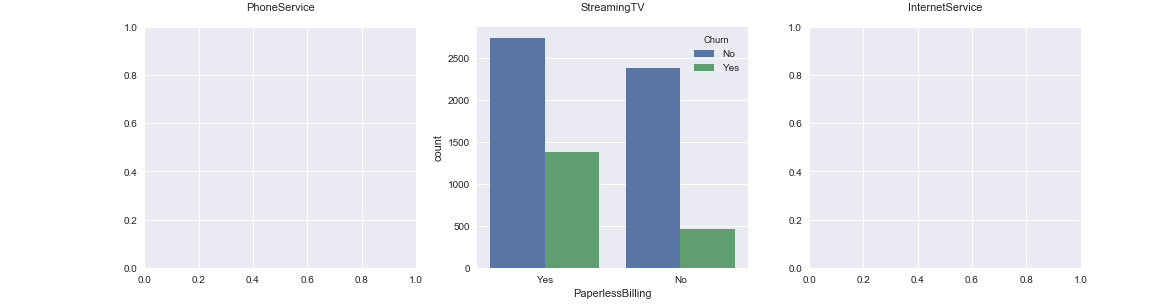
Distribution of Telco Churn on Categoric Variable
After that, the predictor variables will be selected which are categorical and make a bivariate plot, then interpret it. The variables included in the categorical variables are gender, Partner, SeniorCitizen, PhoneServiece, StreamingTV, NoInternetService, and PaperlessBilling.


Summary:
- There is no significant difference for people doing churn in terms of gender and telephone service (Phone Service).
- However, there is a tendency that PEOPLE WHO CHURN are people who:
- do not have a partner (partner: No),
- people whose status is a senior citizen (Senior Citizen: Yes),
- people who have streaming TV services (StreamingTV: Yes) ,
- people who have Internet service (internetService: Yes) and
- people who have paperless bills (PaperlessBilling: Yes).
Model Logistic Regression
The model generated using the logistic regression algorithm by calling LogisticRegression() from sklearn without adding any parameters, the resulting model is a model with the default settings from sklearn. Each dataset training and dataset testing will be evaluated.
Model Evaluation Logistic Regression for Training Model

Visualization of Confusion Matrix

Model Evaluation Logistic Regression for Testing Model

Visualization of Confusion Matrix for Testing Model

Summary:
From the training data, it can be seen that model is able to predict the data by 80% accuracy. The guess of churn that was actually churn was 3405, the guess of churn that was actually not churn was 959, the guess of not churn that was actually not churn was 686 and the guess of not churn that was actually churn was 3132.
From the testing data, it can be seen that the model is able to predict the data by 79% accuracy. The guess of churn that was actually churn was 864, the guess of churn that was actually not churn was 263. the guess of not churn that was actually not churn was 760 and the guess of not churn that was actually churn was 159.
It can be said the model is APPROPRIATE FIT to the data, since the training and testing accuracy is similar
But, since the Retention Cost is lower than Acquistion Cost, it is better if our model has a lower number of customer who actually Churn but predicted as No Churn (False Negative). If that number is high, then the company needs to spend more than it should be. Therefore, we will use Recall metrics.
Hyperparameter Tuning

Summary:
Recall score BEFORE tuning: 0.844574780058651 Recall score AFTER tuning: 0.8572825024437928
Threshold Adjustment

Summary:
PRECISION score BEFORE threshold adjustmet: 77.542 RECALL score BEFORE threshold adjustment: 85.728 PRECISION score AFTER threshold adjustment: 72.72 RECALL score AFTER threshold adjustment: 91.984 PRECISION score difference: -4.8 RECALL score difference: 6.3
Conclusion
By adjusting threshold, the percentage customers who don't get a treatment and run away is decreasing from 15.96% to 10.98%. Meaning, Model A predict around 16 out of 100 customers are predicted as Not Churn but actually they leave the company's products. Meanwhile, using Model B (threshold adjustment), the customers who do not get a treatment and they leave, is only 11 out of 100 people. There was a decrease of up to 31.25%.
However, this adjustment causes the increasing of customer who get a treatment but actually do not churn from 22.46% to 27.28%. Model A predict around 22 out of 100 customers are predicted as Churn but actually they stay. Meanwhile, using Model B, the customers who get a treatment but actually they stay, is 27 out of 100 people. There was a increase of up to 22.7%.
As stated in problem section, Acquisition Cost is 5x higher than Retention Cost. Let's say the Acquisition Cost is 50 USD, meaning the Retention Cost is 10 USD. That means:
- The total cost of using Model A is 1020 USD
- The total cost of using Model B is 820 USD
- Using optimized model will reduce cost up to 19.6%
By knowing which customers are most likely going to churn, the company doesn't need to give treatment to all of the customers. They only need to give treatments to the customers who are predicted to churn. By using the optimized model, the company will give treatments to 1294 customers or 63% of all the customers. In other words, the model helps the company to reduce the customers to be treated up to 37%.
Informasi Course Terkait
Kategori: Data Science / Big DataCourse: Machine Learning For Beginner
