
Insurance Data Analysis: Pre-processing & EDA
Aldona Septiana
Summary
The analysis of insurance data is a crucial process in understanding trends, identifying anomalies, and deriving insights that can inform business decisions. This project focuses on two main stages: pre-processing and exploratory data analysis (EDA). During pre-processing, data cleaning, integration, transformation, and reduction techniques are applied to prepare the dataset for analysis. Following this, EDA employs statistical methods and visualizations to explore correlations, descriptive statistics, and detect anomalies. These steps are essential in transforming raw data into meaningful information, paving the way for more advanced analyses and predictive modeling.
Description
This insurance dataset includes several important features that are relevant for medical insurance cost analysis. These features include age as a numerical variable indicating the age of the individual, sex as a categorical variable with the values 'male' and 'female', body mass index (BMI) as a numerical variable indicating the measure of body fat, number of children as a numerical variable reflecting family dependents, smoking status (smoker) as a categorical variable with values 'yes' and 'no', region of residence (region) as a categorical variable that includes four geographical categories in the US, namely 'southwest', 'southeast', 'northwest', and 'northeast', and insurance charges (charges) as a numerical target variable that represents the medical costs of insured individuals. This dataset aims to predict insurance costs based on individual demographic and health characteristics, and is often used in the context of training and predictive modelling in data science.
Import Library

Reading csv files

Display data information

Data Pre-processing
Data Cleaning
Count the number of missing values

Check duplicate data and display it


Remove duplicate rows

Data Transformation
Transform categorical values into numerical values.

Standardising or normalising numeric features such as age, bmi, children, and charges using StandardScaler is to ensure that each feature has a similar or normal scale.

Exploratory Data Analysis
Descriptive Statistics
Calculating descriptive statistics such as mean, median, mode, and standard deviation.

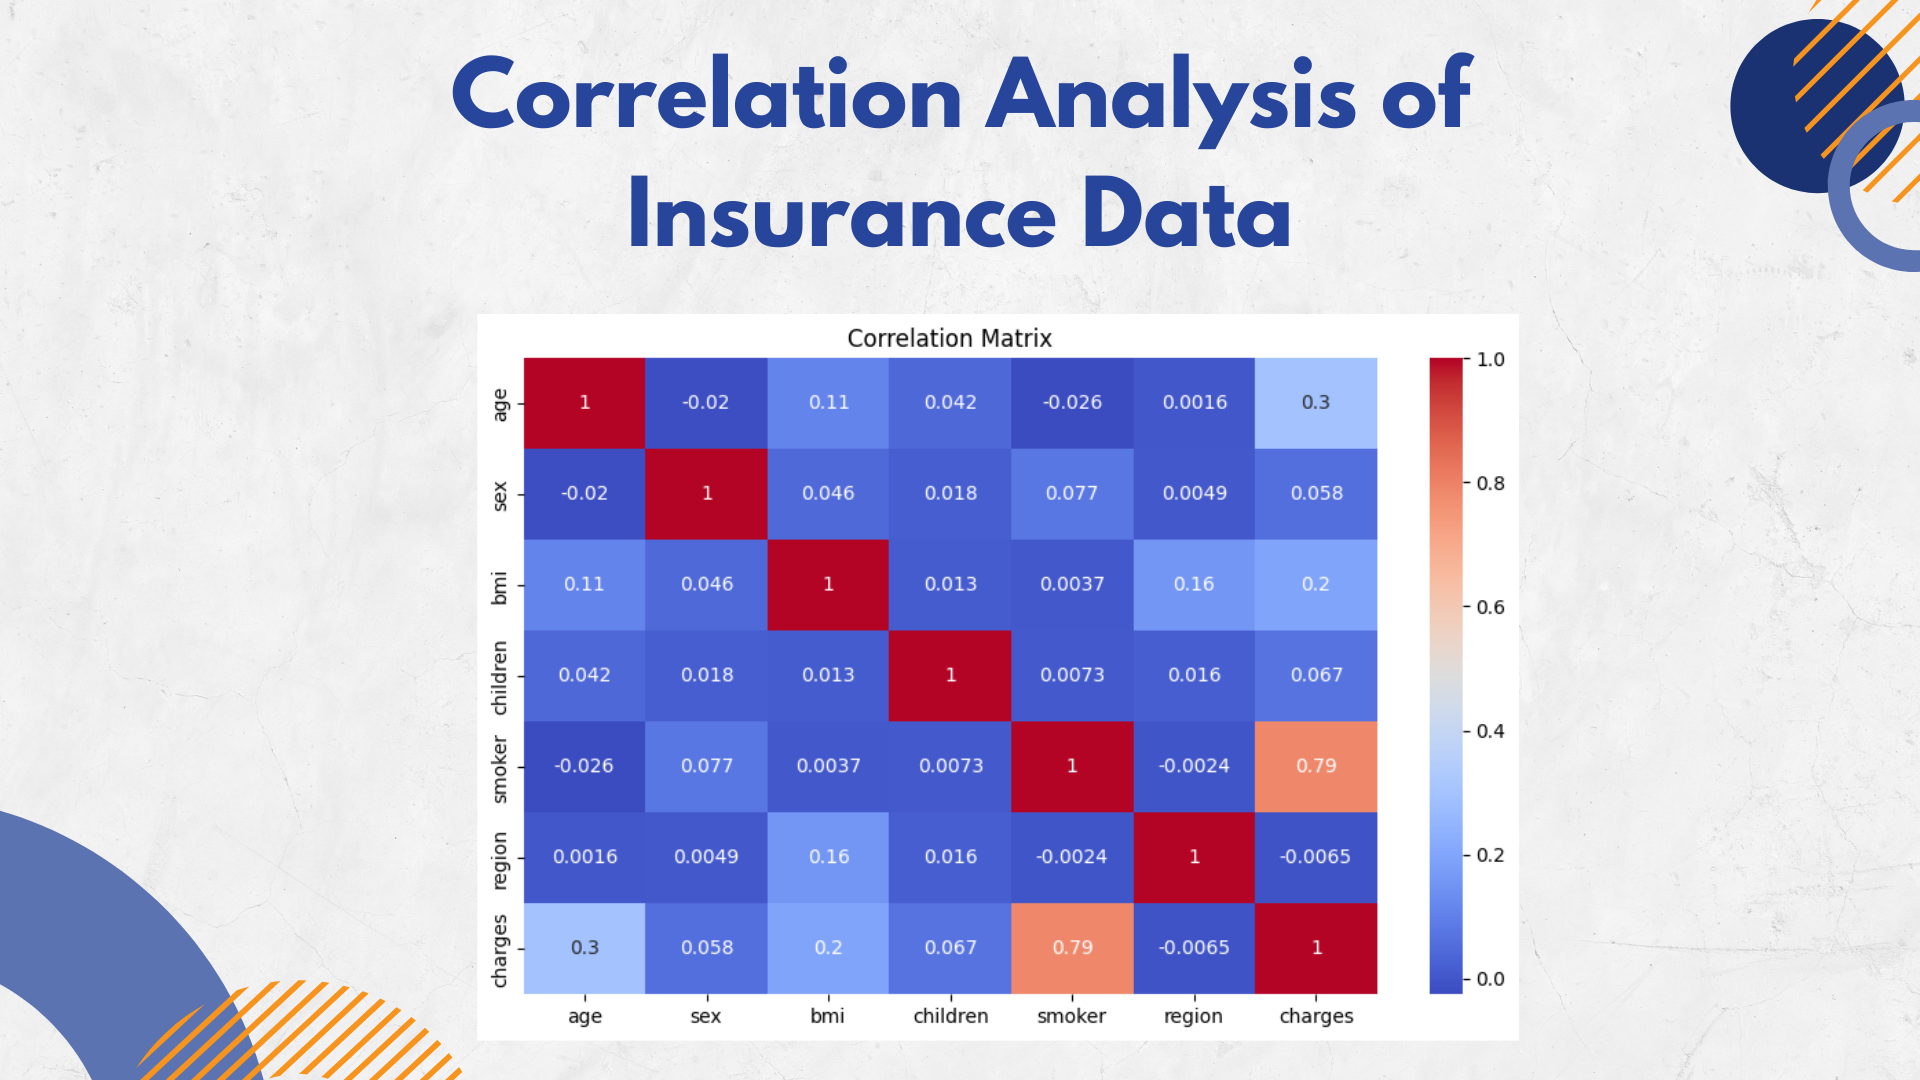
Correlation Analysis
Calculating the correlation between features to find significant relationships.

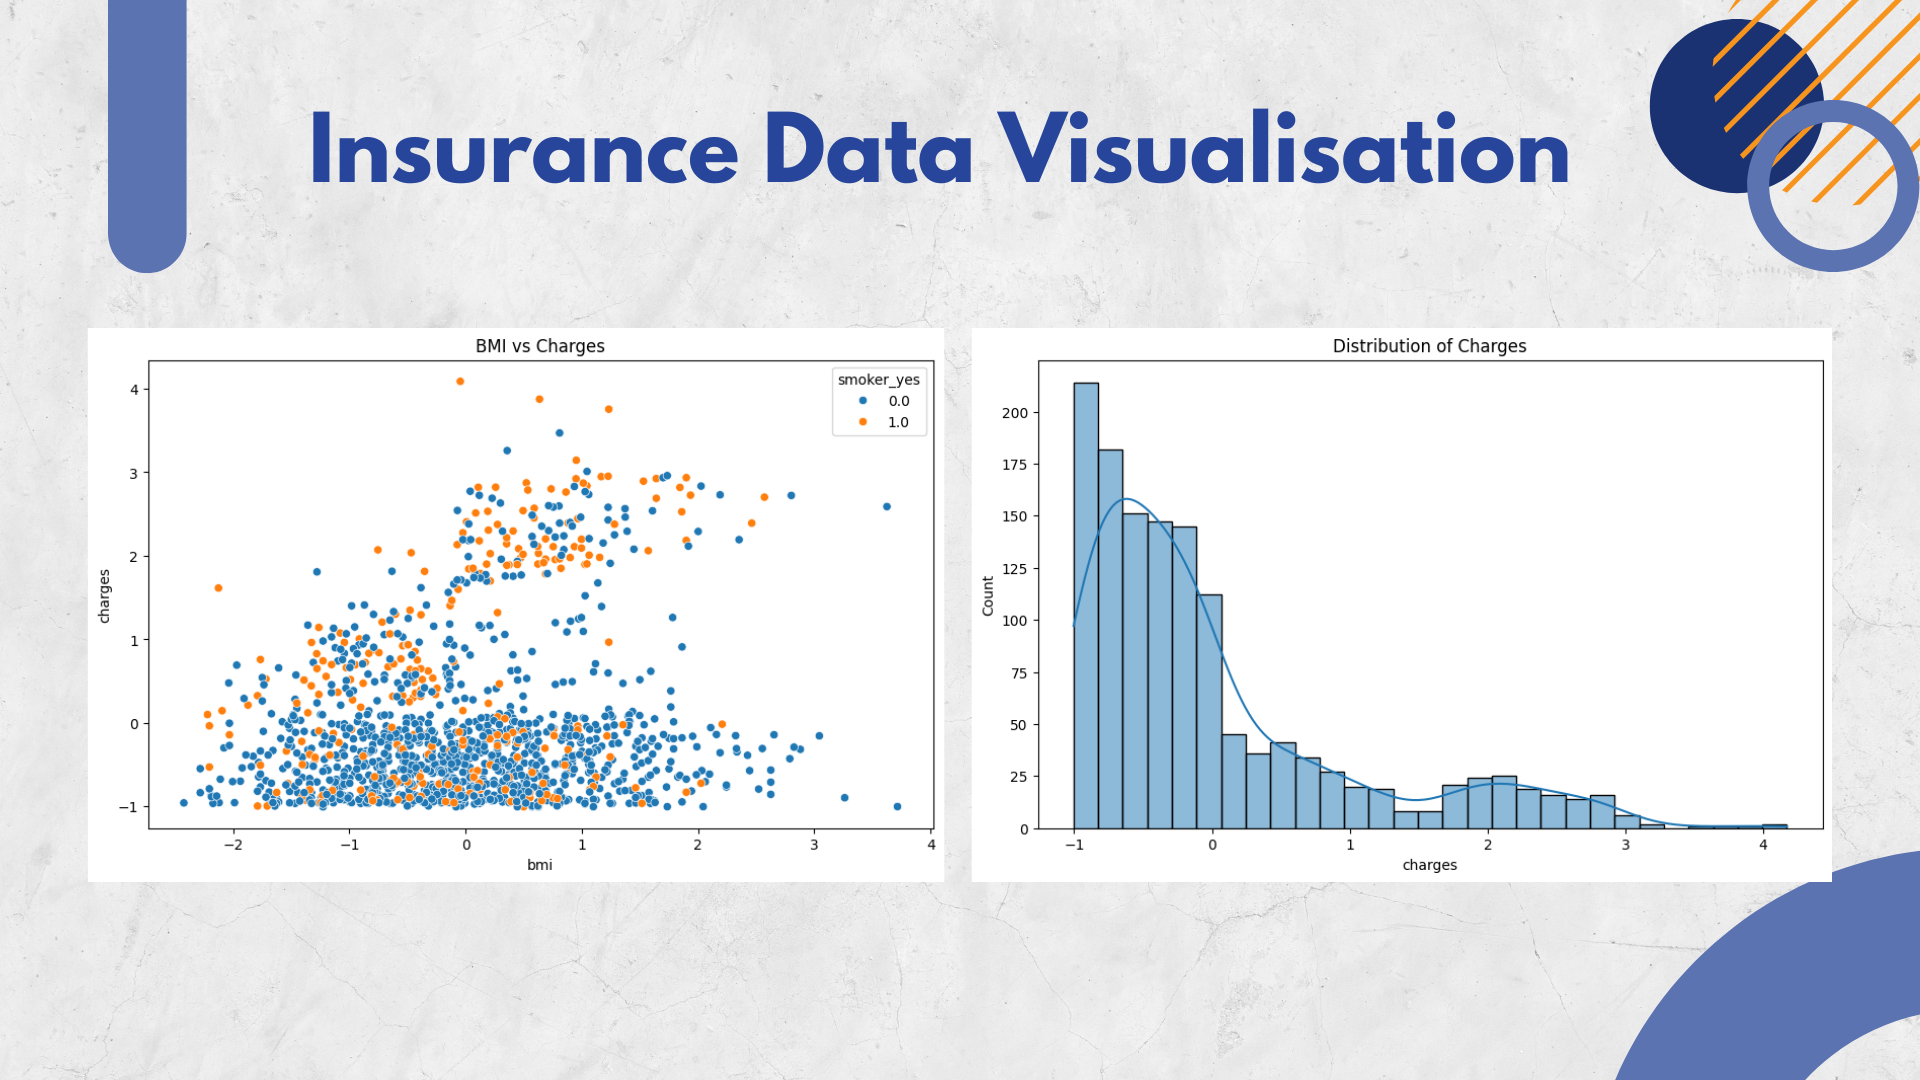
Visualisation
Insurance Cost Distribution

Comparing insurance costs (charges) between smokers and non-smokers is to provide an understanding of the differences in the distribution of insurance costs between these two groups.

Showing the number of individuals by region who receive insurance fees is to provide an understanding of the geographical distribution of the population in the insurance data.
'northeast' = 0
'northwest' = 1
'southeast' = 2
'southwest' = 3

Visualisation of the number of individuals by sex

Visualise the relationship between (BMI) and insurance costs (charges) by utilising colours to distinguish between smokers (smoker = 'yes') and non-smokers (smoker = 'no').

Anomaly Detection
Detecting data that is significantly different from the rest of the data in the dataset

Removing anomalies from the dataset

Conclusion
In insurance data analysis, preprocessing and EDA enable insurance companies to measure risk more accurately, improve claims assessment, and provide better services to customers. In preprocessing, insurance data is processed to remove irrelevant data, change data types, and resolve missing values. Next, EDA is performed to understand the structure and patterns of the data, such as calculating descriptive statistics, correlation, and visualisation.
Informasi Course Terkait
Kategori: Data Science / Big DataCourse: Data Science SIB Batch 6
