Exploratory Data Analysis - Spotify
Hana Shofiyah
Summary
Exploratory Data Analysis (EDA) is a crucial initial phase in the process of understanding and analyzing a dataset. It involves a series of techniques and methodologies aimed at summarizing the main characteristics of the data, often through visualizations and statistical measures. EDA in building a classifier for song-liking prediction on Spotify involves the initial investigation of the dataset to uncover meaningful insights and patterns. This process begins with collecting and preparing the relevant data, including song attributes and your preferences (like or dislike). Using techniques like data visualisation and statistical summaries, EDA helps you understand the distribution of various features, such as artist, genre, tempo, and acoustics.
Through EDA, you can identify trends and differences between songs you like and those you don't. This understanding is crucial for selecting the most informative features and crafting a predictive model to accurately determine your song preferences. EDA also aids in recognizing potential outliers, handling missing data, and assessing class imbalances, which are essential considerations for building a robust classifier. In essence, EDA serves as the foundation for making informed decisions throughout the development of your song-liking prediction system on Spotify, leading to a more effective and personalized music recommendation system.
Description
The dataset titled "Spotify Song Attributes," acquired from Kaggle, is a comprehensive collection of information about various attributes associated with songs available on the popular music streaming platform, Spotify. This dataset encompasses a wide array of crucial details related to music tracks, offering deep insights into their characteristics. It includes fundamental information such as song titles and the corresponding artists or bands. Moreover, it provides unique Spotify IDs for each song, facilitating precise identification within the Spotify ecosystem. Additionally, the dataset encompasses key indicators of song popularity, duration, tempo (in beats per minute), musical key and mode, time signature, and various audio features like acousticness, danceability, energy, instrumentalness, liveness, loudness, speechiness, and valence. These audio features provide valuable insights into the music's acoustic properties and mood. Furthermore, the dataset includes information about the song's genre or genre-related tags and the year of its release. This dataset serves as an invaluable resource for music analysts, data scientists, and enthusiasts, enabling them to perform a wide range of analyses, from building recommendation systems to exploring music trends, genre classification, and more.
Here's a brief overview of how EDA can be applied in the context of Spotify song prediction project:
Load Dataset
Start by collecting relevant data from Spotify. This data may include song attributes such as artist, genre, tempo, danceability, energy, and acousticness.
This data was collected six years ago, so it's a bit outdated. But, it has 17 different columns.
Data Cleaning
Check for missing values, duplicates, and outliers in your dataset. Clean the data to ensure its quality and reliability. In this case, unnamed column have to get rid of this, so the column just going to drop permanently.
Preprocessing Data
Check the data that we don't have any missing values so our data set is quite clean
Data Information
It is important to check the data types of columns in the Spotify dataset. By knowing the data types of each column, it can perform data manipulation and analysis that is appropriate for the type of information stored in each column. Besides that, this helps determine the number of rows in the dataset and indicates it has no missing data in the dataset. So, the dataset is quite clean already.
Statistical Summary
Compute basic statistics (e.g., mean, median, standard deviation) for numeric features and frequency counts for categorical features. This helps to understand the central tendencies and distributions of data.
Data Analysis and Data Visualization
Create various visualizations to better understand the data. Some common EDA plots and charts for Spotify song prediction, I used :
Histogram: Visualize the distribution of numeric features, such as tempo and energy, to identify patterns or differences between liked and disliked songs.
Bar Chart: Compare the frequency of different genres or artists.
Pie Charts: A pie chart can be used to visualize the percentage of songs or artists that are most liked based on data.
Top 5 Most Popular Artist
It will contain a list of the top five artists with the most songs in a data frame that contains information about songs, including the artist along with the count of song titles.
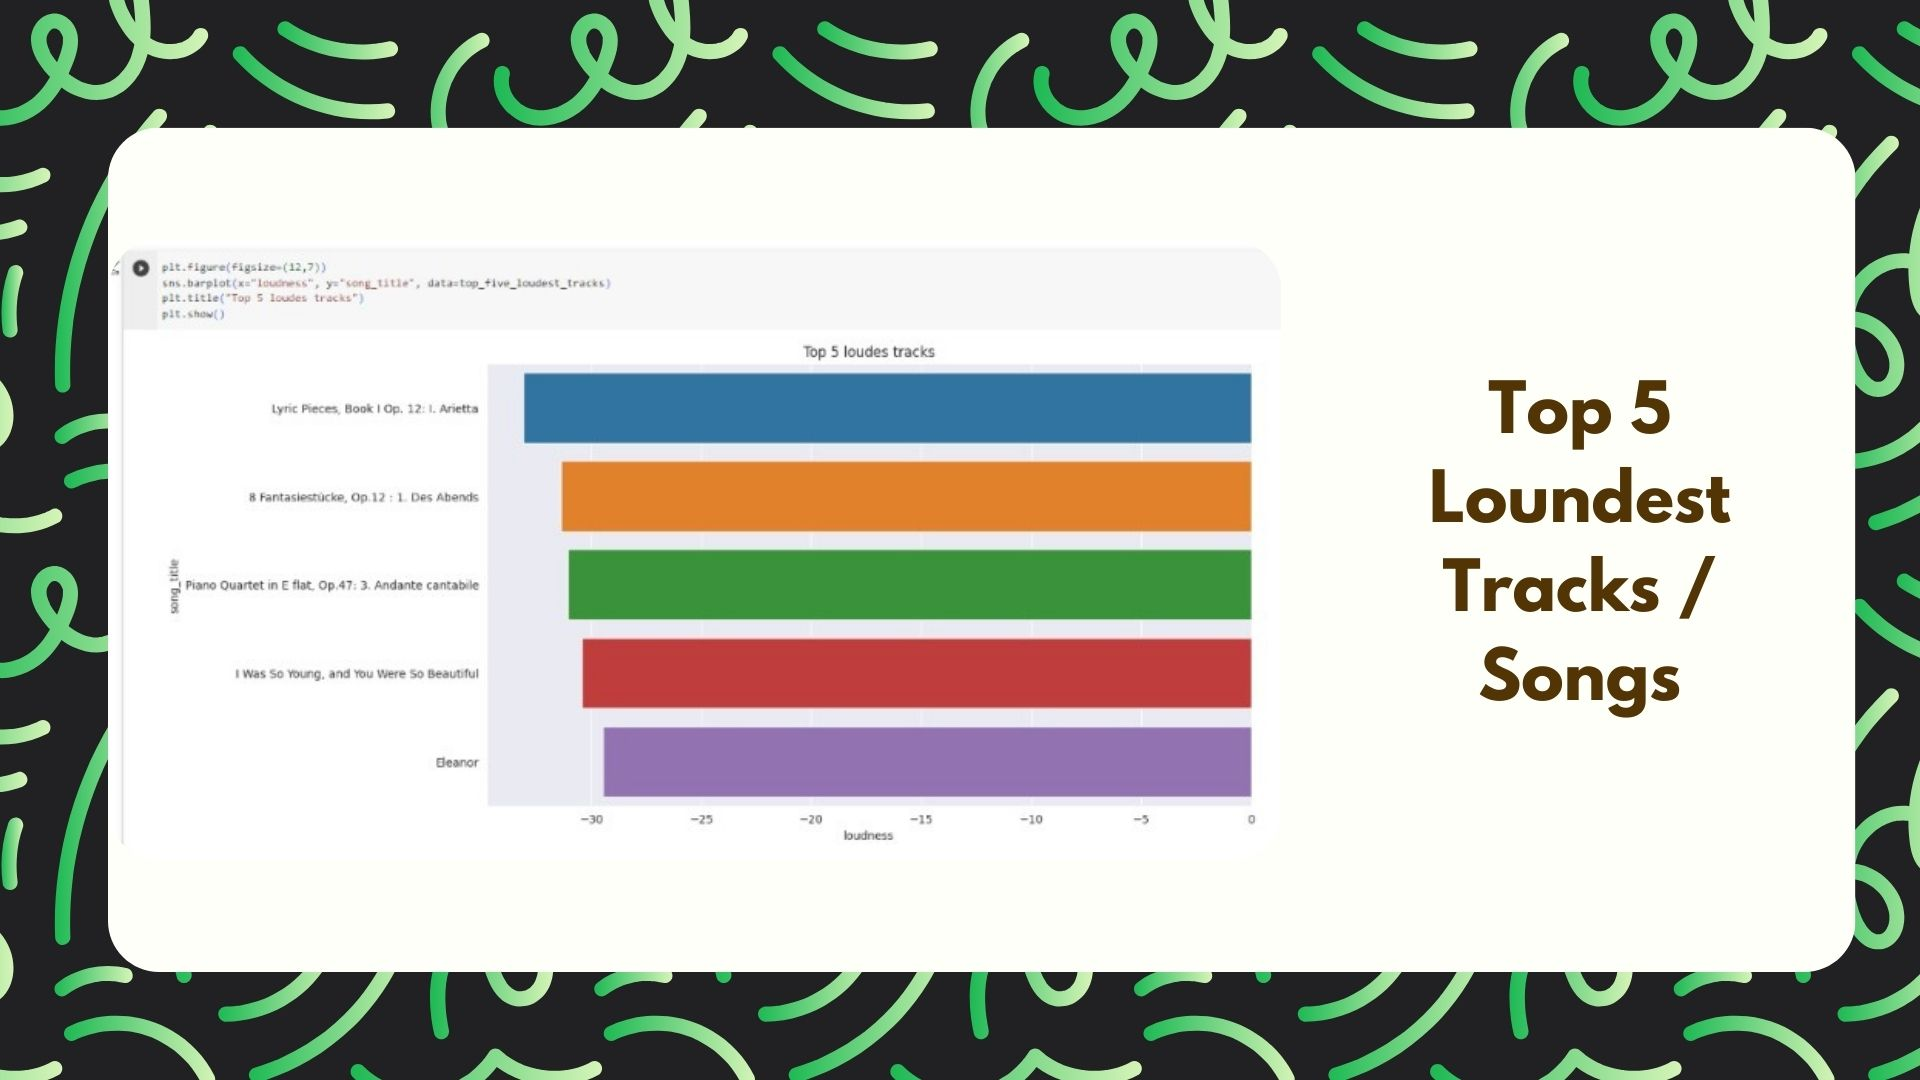
Top 5 Loudest Tracks
It will contain a list of the top five tracks with the loudest songs in a data frame that contains information about loudness, including the loudness and song title.
Top 5 Artist Danceable Songs
It will contain a list of the top songs with the most danceability songs in a data frame that contains information about the artist, including the danceability, artist, and song title.
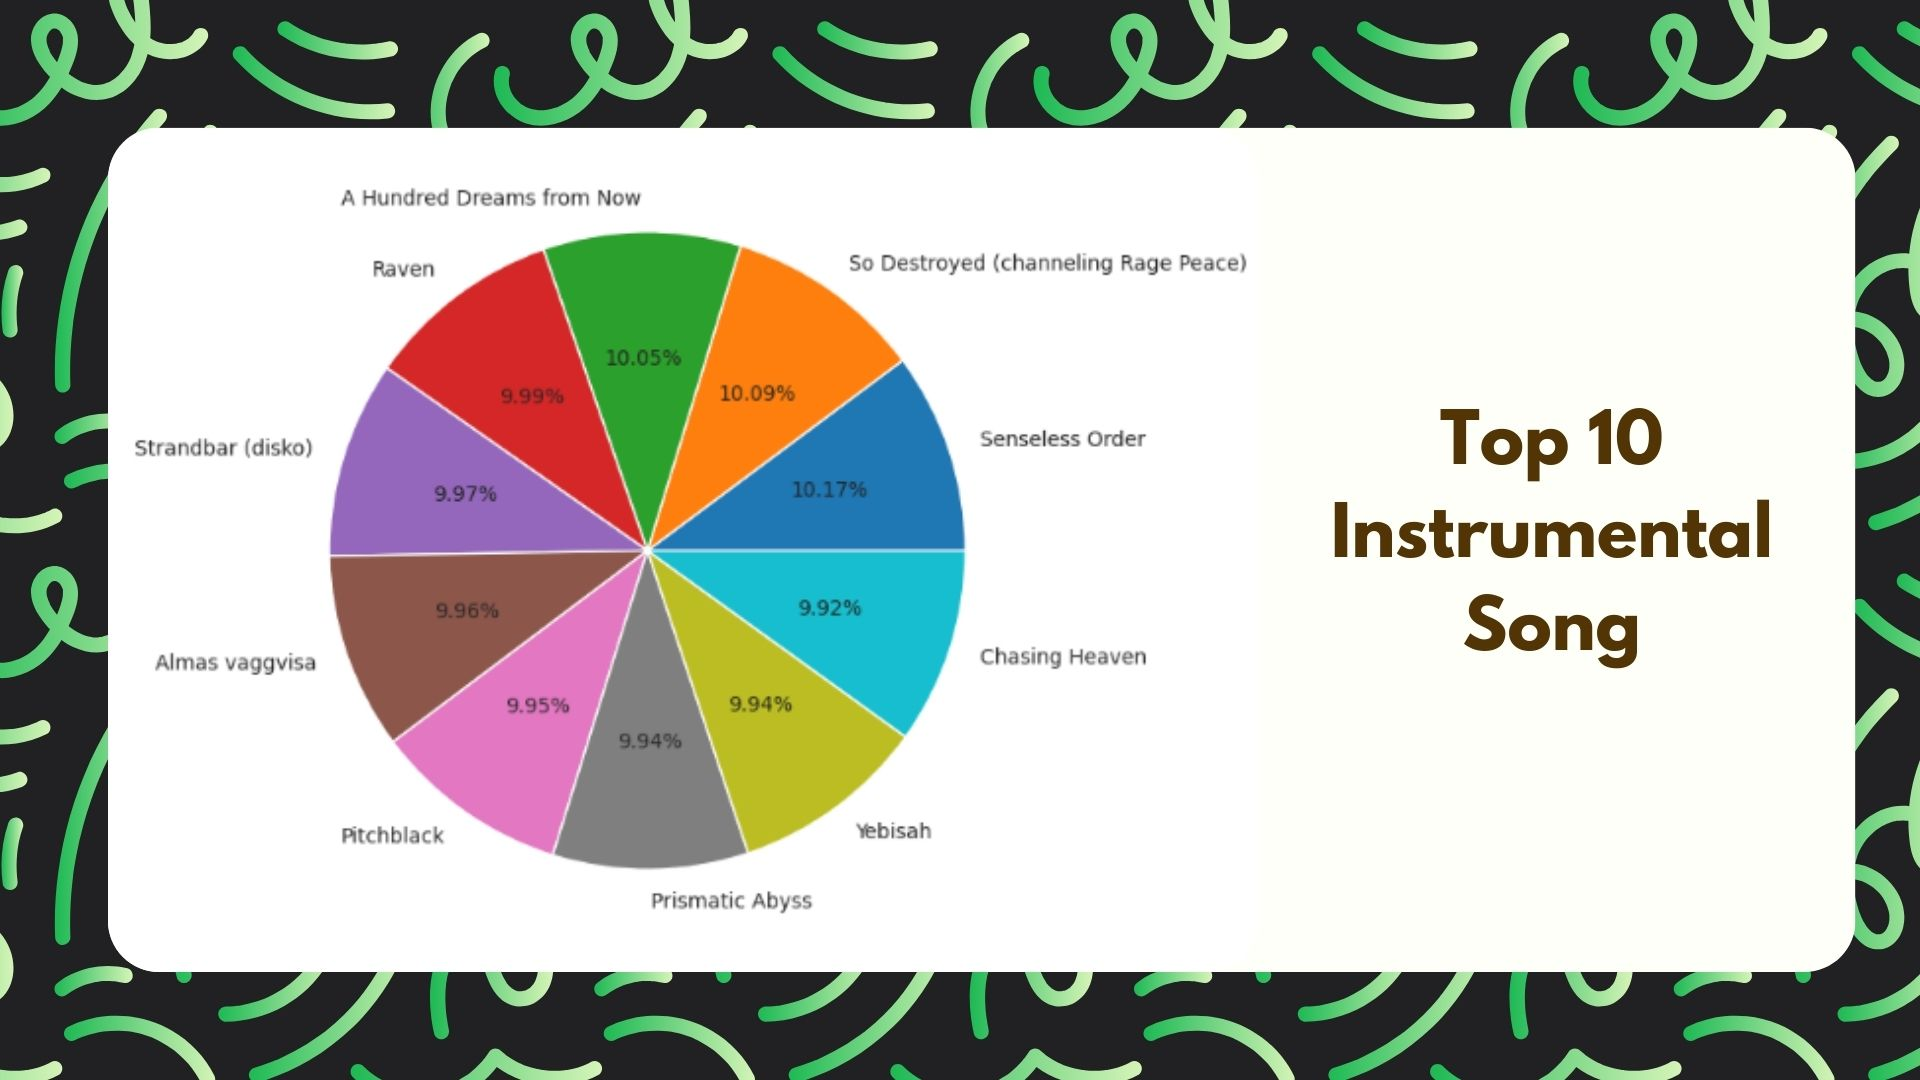
Top 10 Instrumentalness Song
It will contain a list of the top artists with the most danceable songs in a data frame that contains information about song_title, including the danceability, artist, and song title.
Multiple Feature Platforms
This multifaceted approach enables insights into music preferences, trends, and user engagement, as well as the effectiveness of Spotify's recommendation system. Multiple feature platforms in Spotify EDA allow for a more detailed and thorough exploration of the dataset, revealing valuable insights across various dimensions of music data analysis.
The green ones are what people like and the red one is what people don’t like.
The overall estimated tempo of a track is in beats per minute (BPM). In musical terminology, tempo is the speed or pace of a given piece and derives directly from the average beat duration. People like a tempo of around 130-140 that tempo is good but too fast. When it is too slow people don’t also like the pace of the music.
The overall loudness of a track in decibels (dB). Loudness values are averaged across the entire track and are useful for comparing the relative loudness of tracks. Loudness is the quality of a sound that is the primary psychological correlate of physical strength (amplitude). Values typically range between -60 and 0 db. The loudness of the song is measured in decibels. When the decibels are on -15 to around -7 people like such songs. Then people begin to dislike it when it becomes extremely loud.
A confidence measure from 0.0 to 1.0 of whether the track is acoustic. 1.0 represents high confidence the track is acoustic. Most of the people dislike it.
Danceability describes how suitable a track is for dancing based on a combination of musical elements including tempo, rhythm stability, beat strength, and overall regularity. A value of 0.0 is the least danceable and 1.0 is the most danceable. People like songs that are more have a higher danceability than a song that doesn’t have high danceability. It is quite balanced in both directions.
The duration of the track is in milliseconds. The duration of a song does not really matter for people, because the more people vibe with the song, the more the duration of the song.
Energy is a measure from 0.0 to 1.0 and represents a perceptual measure of intensity and activity. Typically, energetic tracks feel fast, loud, and noisy. For example, death metal has high energy, while a Bach prelude scores low on the scale. Perceptual features contributing to this attribute include dynamic range, perceived loudness, timbre, onset rate, and general entropy. From that graph we can conclude, that people who like and don't like it are quite similar. Many people like energetic songs, and many people dislike it.
Instrumental can predict whether a track contains no vocals. "Ooh" and "aah" sounds are treated as instrumental in this context. Rap or spoken word tracks are clearly "vocal". The closer the instrumentalness value is to 1.0, the greater the likelihood the track contains no vocal content. Values above 0.5 are intended to represent instrumental tracks, but confidence is higher as the value approaches 1.0. Most people dislike it and prefer to play the opposite genre.
Detects the presence of an audience in the recording. Higher liveness values represent an increased probability that the track was performed live. A value above 0.8 provides a strong likelihood that the track is live. Most people do not really enjoy the real voice of the song.
Speechiness detects the presence of spoken words in a track. The more exclusively speech-like the recording (e.g. talk show, audiobook, poetry), the closer to 1.0 the attribute value. Values above 0.66 describe tracks that are probably made entirely of spoken words. Values between 0.33 and 0.66 describe tracks that may contain both music and speech, either in sections or layered, including such cases as rap music. Values below 0.33 most likely represent music and other non-speech-like tracks. It is quite a balance between people likely to represent music and other non-speech-like tracks and not.
A measure from 0.0 to 1.0 describes the musical positiveness conveyed by a track. Tracks with high valence sound more positive (e.g. happy, cheerful, euphoric), while tracks with low valence sound more negative (e.g. sad, depressed, angry). It is quite balanced in both directions. Depends on the song's feel.
Informasi Course Terkait
Kategori: Data Science / Big DataCourse: Data Science


