
Pulsars Predictions
Al Fathjri Wisesa


Summary
A pulsar is a rare type of neutron star that emits detectable radio emissions on Earth. It is formed from the remnants of a massive star that has undergone a supernova explosion. Pulsars are characterized by their rapid rotation and highly magnetic fields, which cause beams of radiation to sweep across space like a cosmic lighthouse.
Description
Pulsar HTRU2 CRISP-DM
Dataset

The pulsar HTRU2 dataset is a collection of astronomical observations aimed at detecting pulsars, which are highly magnetized rotating neutron stars. The dataset contains various attributes or features derived from radio emissions, such as mean integrated profile, standard deviation of integrated profile, excess kurtosis of integrated profile, skewness of integrated profile, mean DM-SNR (Signal-to-Noise Ratio), standard deviation of DM-SNR, excess kurtosis of DM-SNR, and skewness of DM-SNR. These attributes capture different characteristics of the radio emissions and serve as input variables for classification models. The target variable is the class label indicating whether an observation is a pulsar or not. The dataset is used for training and evaluating machine learning models to identify pulsars based on their radio emission patterns.
Business Understanding
A pulsar is a rare type of neutron star that emits detectable radio emissions on Earth. It is formed from the remnants of a massive star that has undergone a supernova explosion. Pulsars are characterized by their rapid rotation and highly magnetic fields, which cause beams of radiation to sweep across space like a cosmic lighthouse.
Pulsars are important in several scientific aspects. Firstly, they provide insights into the nature of matter under extreme conditions. Secondly, pulsars are valuable tools for studying the properties of spacetime. Furthermore, pulsars serve as natural laboratories for studying astrophysical phenomena. Moreover, pulsars have practical applications in navigation and timekeeping.
In summary, pulsars are of great scientific importance as they offer opportunities to explore the properties of matter, investigate the nature of spacetime, and study astrophysical phenomena. Their unique characteristics and emissions make them invaluable tools for advancing our knowledge of the universe and its fundamental processes.
To increase the understanding of pulsars and explore ways to enhance research and analysis, we can consider the following questions:
What are the factors that contribute to the discovery of pulsars?
By examining the characteristics and properties of previously discovered pulsars, we can identify the common factors that lead to their detection. This information can guide future pulsar search strategies and increase the chances of finding new pulsars.
Is there a correlation between the characteristics of pulsars and their scientific significance?
By analyzing the properties, such as rotational period, pulse profile, magnetic field strength, and location in the galaxy, we can identify any trends or relationships between these factors and the scientific importance of pulsars. This understanding can help prioritize observations and focus research efforts on pulsars with potentially groundbreaking scientific insights.
Are there specific time windows or observational conditions that are more conducive to detecting pulsars?
By analyzing the historical data and observational records, we can identify any patterns or trends in the availability and detectability of pulsars. This information can help researchers optimize their observing strategies and allocate resources effectively during favorable periods for pulsar discovery.
Can machine learning techniques be applied to pulsar data analysis?
By utilizing machine learning algorithms, we can explore patterns, correlations, and anomalies within pulsar data. This can assist in automated pulsar classification, predicting pulsar properties, and identifying new pulsar candidates. Machine learning can potentially enhance the efficiency and accuracy of pulsar research.
Are there specific regions or types of galaxies that are more likely to host pulsars?
By studying the distribution and spatial clustering of known pulsars, we can investigate whether certain galactic environments or stellar populations are more conducive to pulsar formation. This knowledge can guide future surveys and target selection for pulsar searches.
By addressing these questions, we can gain insights into pulsar research strategies, optimize observation methods, and enhance our understanding of pulsars, leading to increased scientific discoveries and advancements in the field.
Data Understanding
Importing Library

Importing Dataset
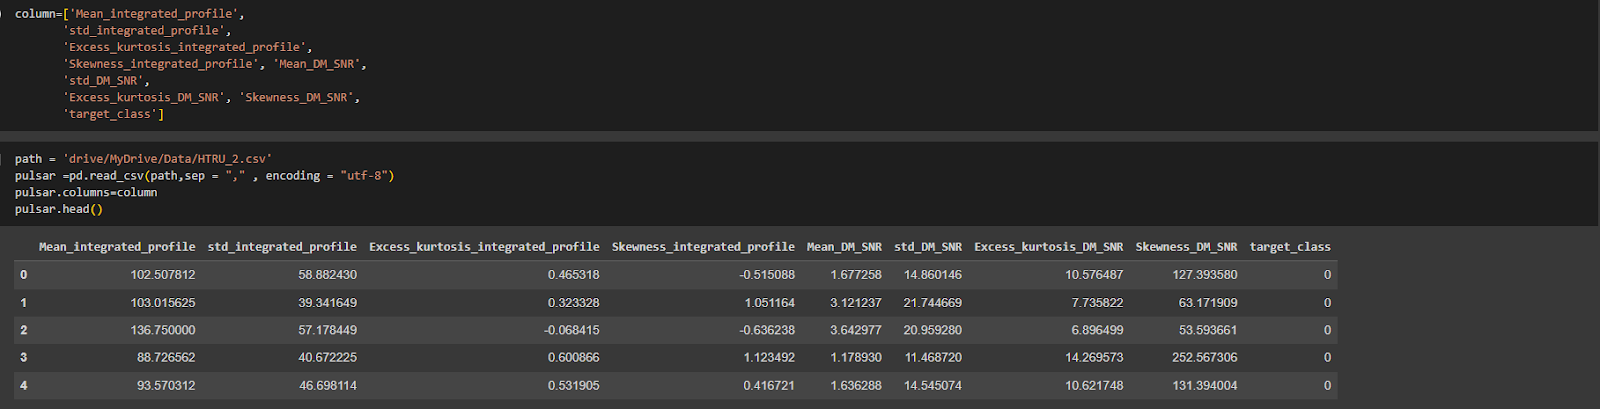
The attributes in the Pulsar HTRU2 dataset are as follows:
- Mean of the integrated profile: The average of the integrated profile of the pulsar signal in arbitrary units.
- Standard deviation of the integrated profile: The standard deviation of the integrated profile of the pulsar signal in arbitrary units.
- Excess kurtosis of the integrated profile: The excess kurtosis of the integrated profile of the pulsar signal in arbitrary units.
- Skewness of the integrated profile: The skewness of the integrated profile of the pulsar signal in arbitrary units.
- Mean of the DM-SNR curve: The average of the DM-SNR curve in arbitrary units.
- Standard deviation of the DM-SNR curve: The standard deviation of the DM-SNR curve in arbitrary units.
- Excess kurtosis of the DM-SNR curve: The excess kurtosis of the DM-SNR curve in arbitrary units.
- Skewness of the DM-SNR curve: The skewness of the DM-SNR curve in arbitrary units.
- Class: The target attribute indicating whether the signal is from a pulsar (1) or not (0).
Structure Data

The dataset is structured and contains 17,897 rows and 9 columns. Each row represents a specific entry, and each column represents a different attribute or feature of the data. The columns include various characteristics of pulsars such as mean integrated profile, standard deviation, excess kurtosis, skewness, and the target class. The structured format allows for efficient storage, retrieval, and analysis, enabling researchers to gain valuable insights into pulsar characteristics and patterns.
Descriptive statistics
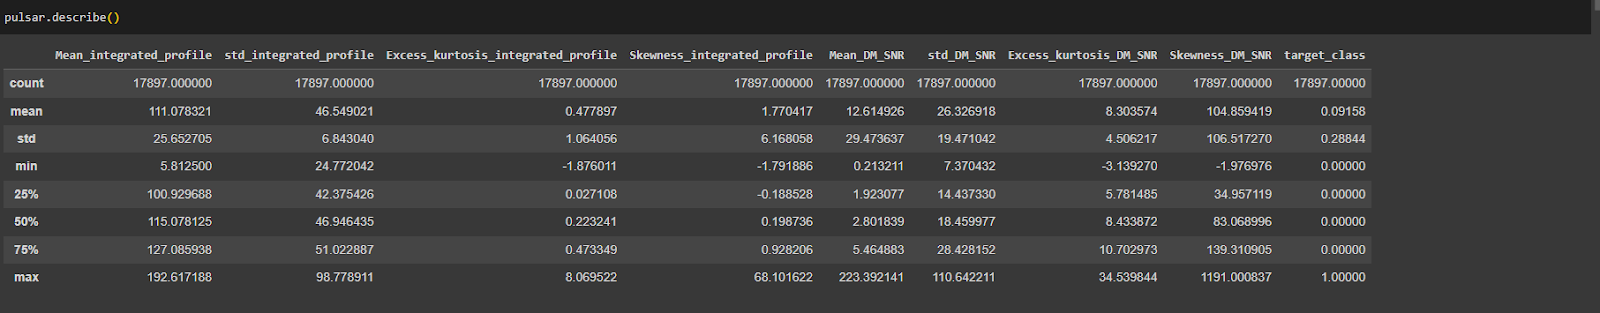
The descriptive statistics reveal important numerical characteristics of each column in the dataset. They provide insights into the average value, variability, peakedness/flatness, and skewness of various features such as the integrated profile and DM-SNR. Additionally, the statistics highlight the distribution of the target class, with approximately 9.16% belonging to the positive class and 90.84% to the negative class. These summary statistics offer a concise overview of the numerical properties of the pulsar dataset, aiding in understanding its characteristics and distributions.
Check Missing Value

No missing values are found in any of the columns of the dataset. The dataset is complete, without any null or empty values, ensuring data integrity for reliable analysis and modeling. Researchers can proceed confidently with further analysis and interpretation.
Data Outliers


The dataset contains outliers in multiple columns, including "Mean_integrated_profile," "std_integrated_profile," "Excess_kurtosis_integrated_profile," "Skewness_integrated_profile," "Mean_DM_SNR," "std_DM_SNR," "Excess_kurtosis_DM_SNR," "Skewness_DM_SNR," and "target_class." The number of outliers varies for each column, with the highest number found in the "target_class" column (1639 outliers). Addressing outliers is crucial as they can greatly influence data analysis and modeling outcomes.
Correlation
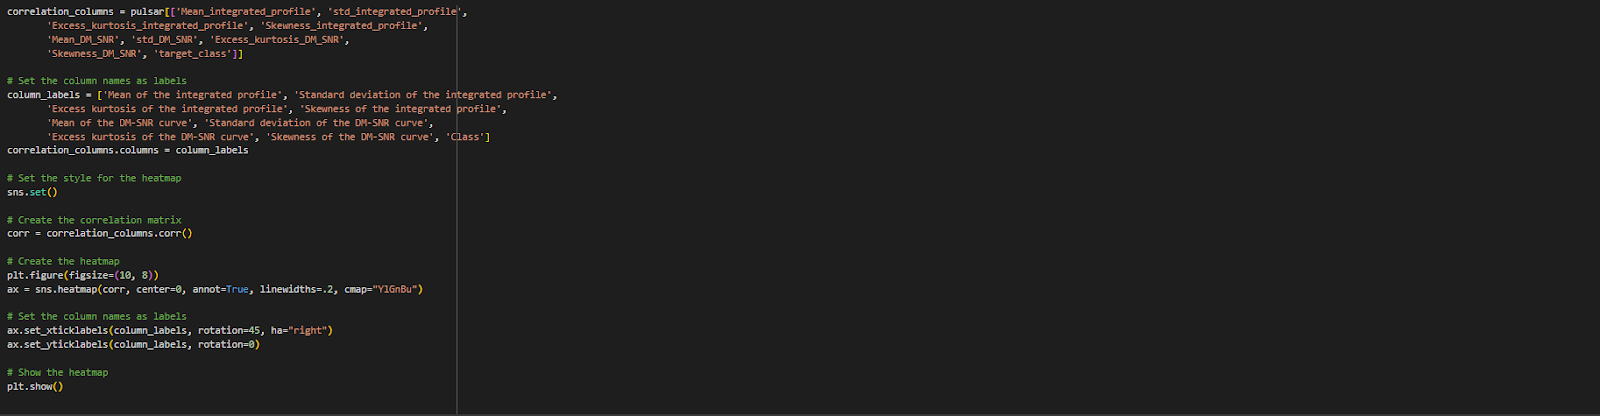

The correlation function in the pulsar dataset is used to measure the relationship between variables. It helps us understand the extent of the relationship between each pair of variables, such as "Mean_integrated_profile" and "Mean_DM_SNR". By calculating correlations, we can identify whether the relationship between variables is positive or negative. This information enables us to understand the interdependence between features in the pulsar dataset and select the most influential features for further analysis.
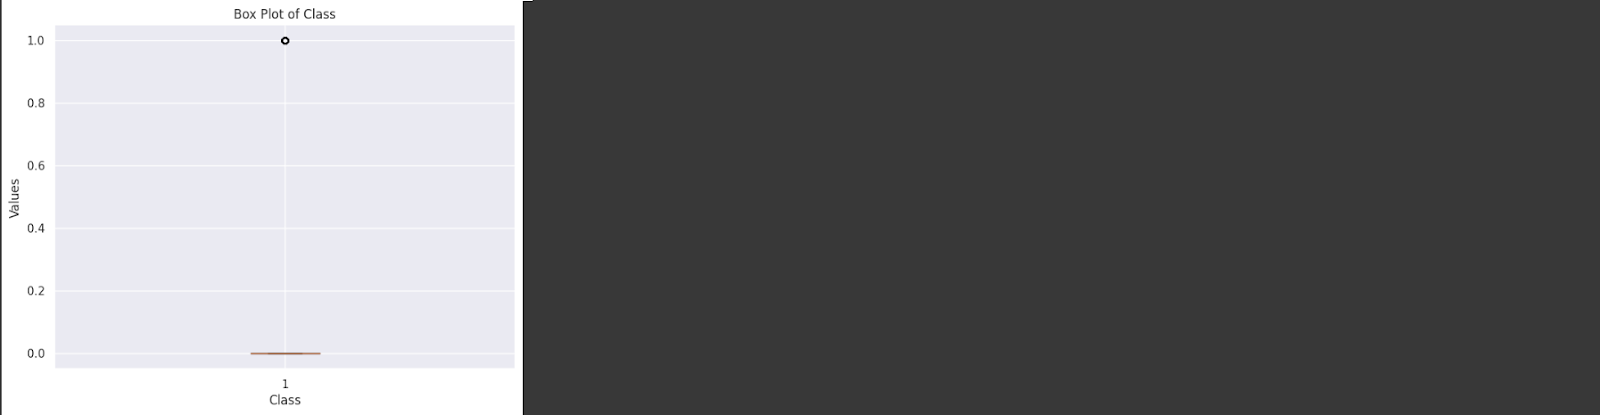
Class Distribution
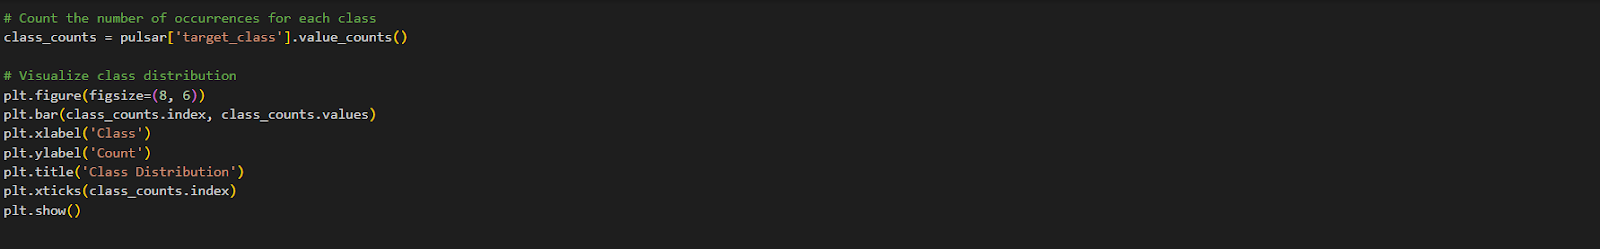

The class distribution in the pulsar dataset refers to the proportion of positive and negative classes, indicating the presence or absence of pulsars. Analyzing the class distribution helps in understanding the balance or imbalance between these classes, which is important for evaluating classification models.
data visualization
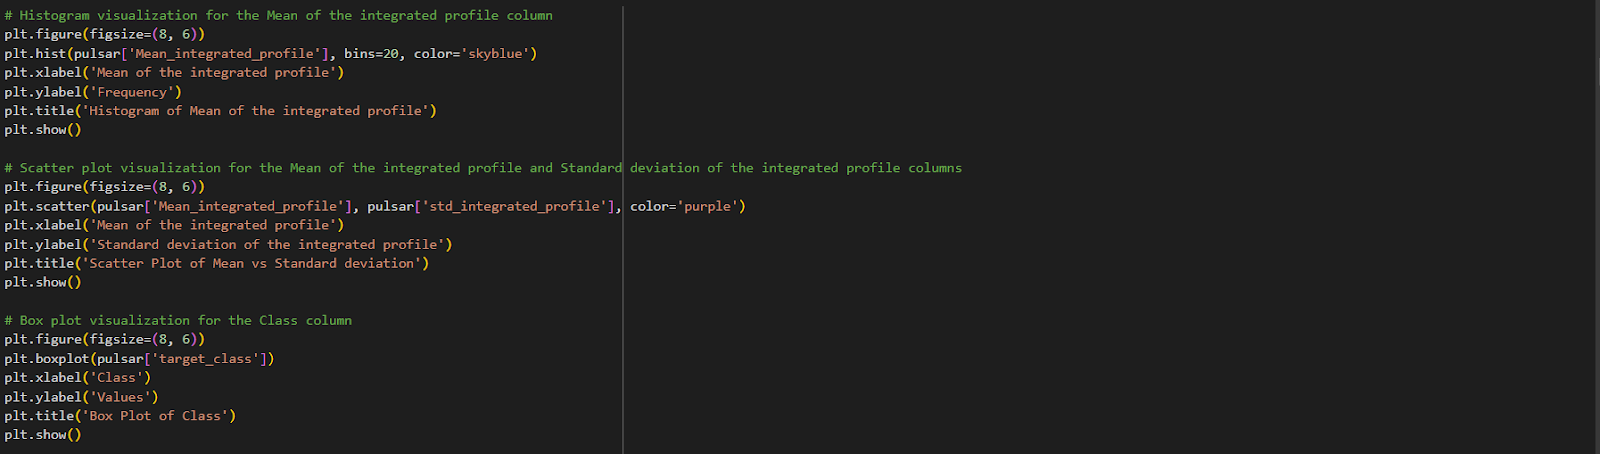
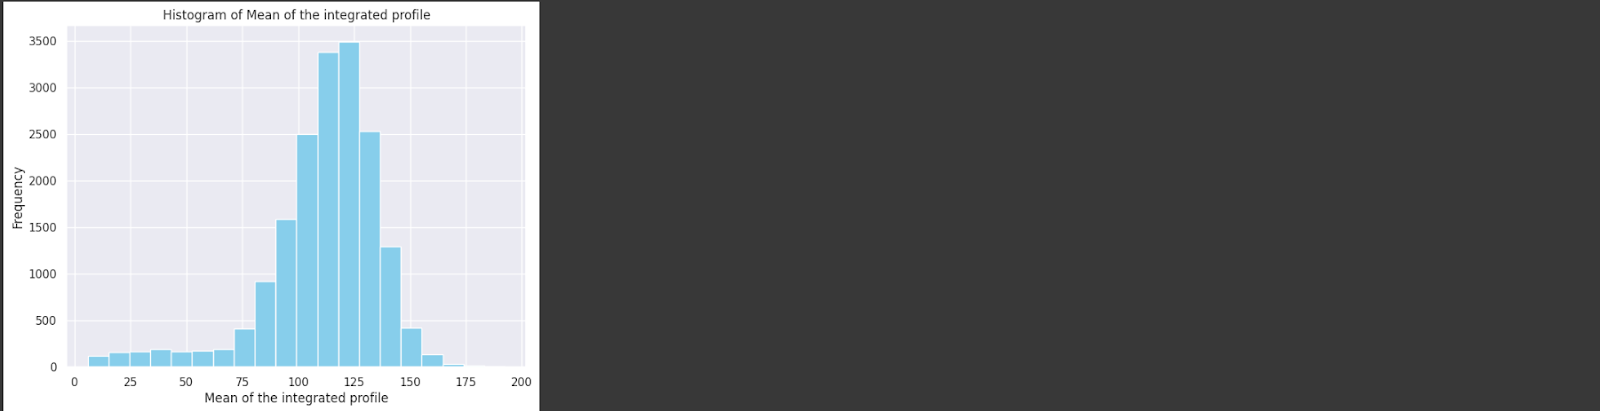
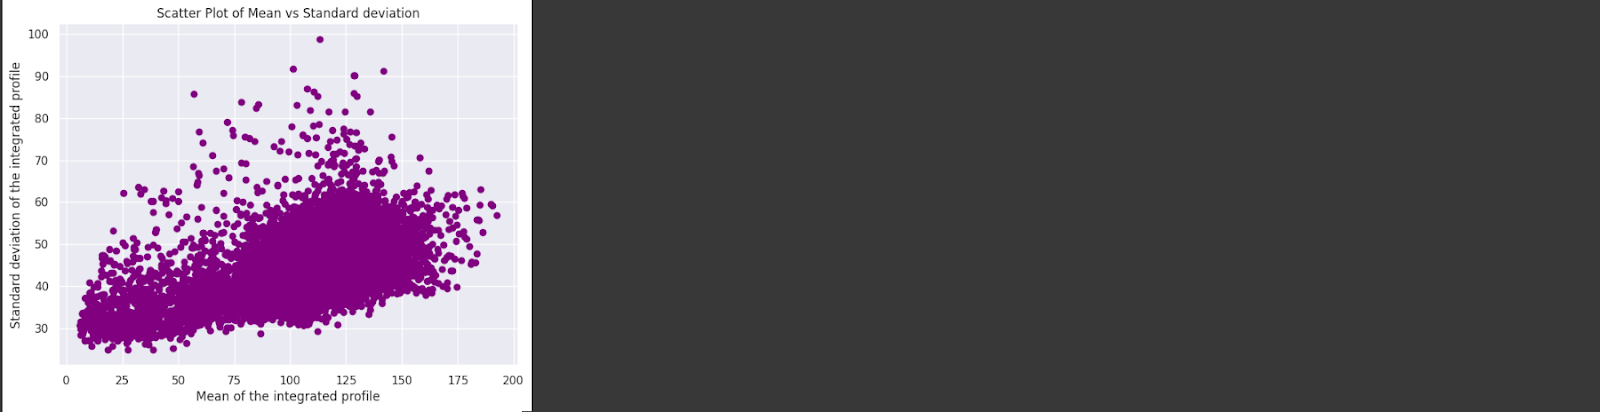
Data visualization for pulsar data involves using graphs and charts to visually represent the dataset. This helps in understanding patterns, detecting outliers, exploring relationships between variables, and visualizing class distributions. It enhances data exploration, analysis, and decision-making processes.
Data Preparation
Cleaning Data

Cleaning the pulsar data involves identifying and handling missing values, invalid or inconsistent values, and noise. It includes steps such as identifying missing values, handling them by either removing or imputing the missing values, and detecting and addressing outliers. Proper data cleaning in the pulsar dataset is essential to ensure data accuracy and quality before conducting further analysis.
Dimension reduction (PCA)
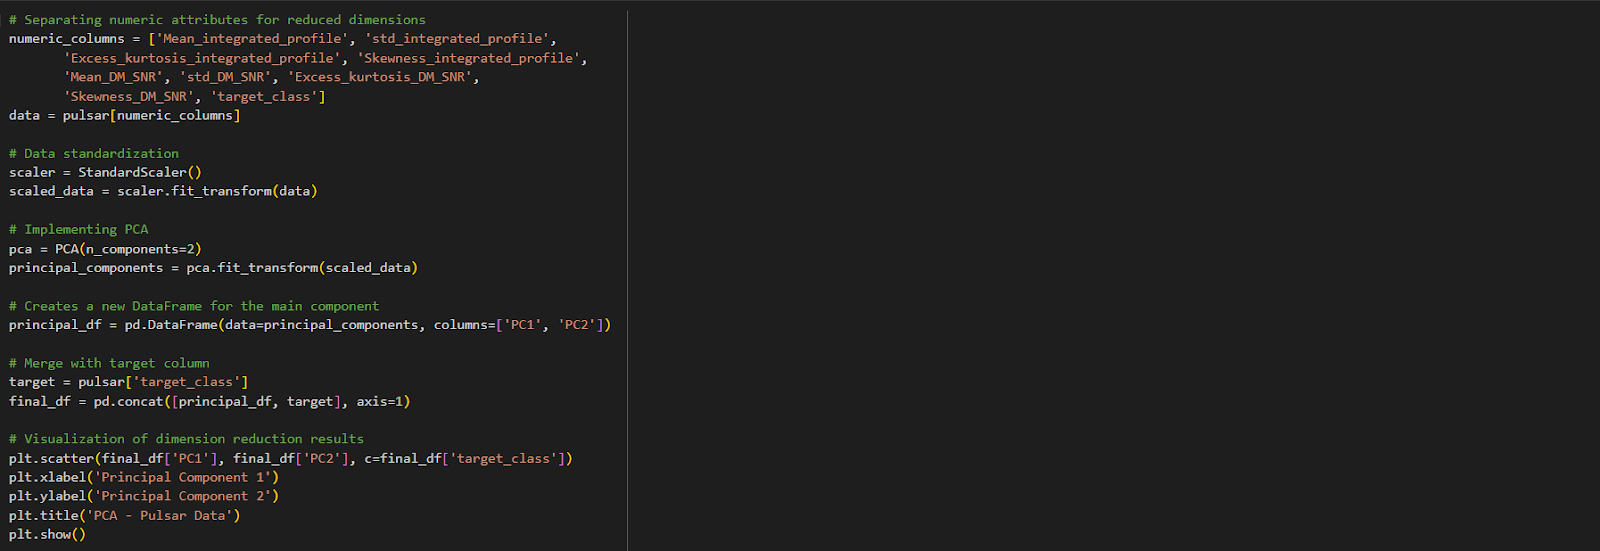
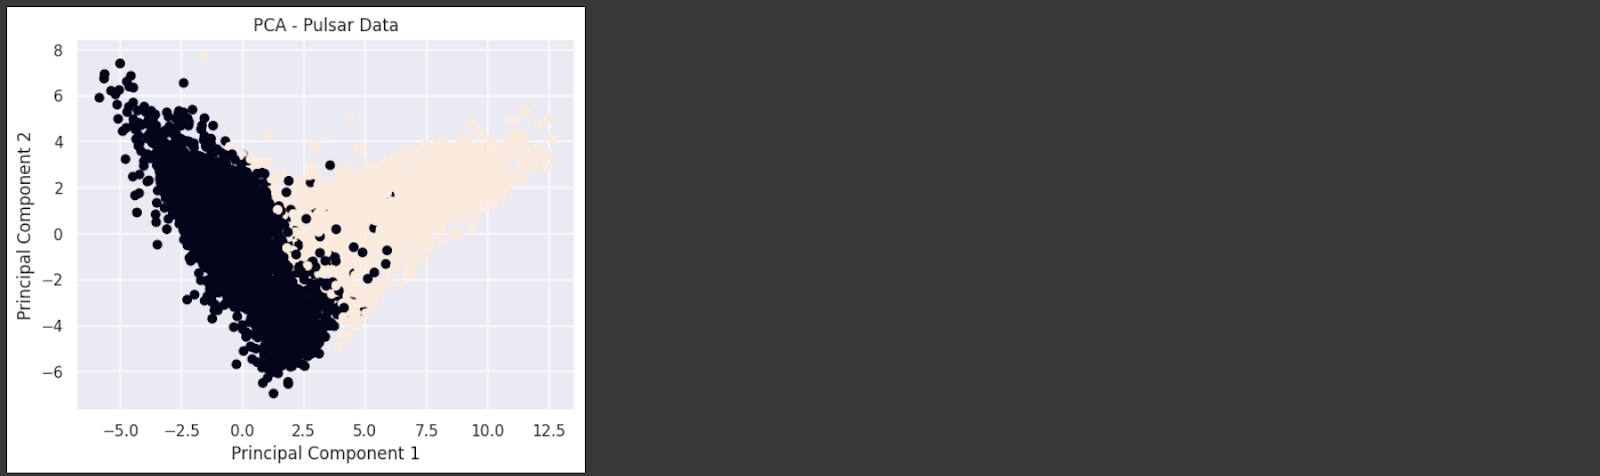
Dimensionality reduction in pulsar data involves reducing the number of features while preserving important information. Techniques like PCA and t-SNE transform the data into a lower-dimensional space, simplifying the dataset and improving visualization and analysis efficiency.
Oversampling

Split Dataset

To split the HTRU2 dataset, you can use a technique called train-test split. This involves dividing the dataset into two subsets: a training set and a testing set. The training set is used to train the machine learning model, while the testing set is used to evaluate its performance.
Modeling
Logistic Regression

Logistic Regression is a linear classification algorithm used for binary or multi-class classification. It models the relationship between the features and the class label using the logistic function. Logistic Regression estimates the probabilities of each class and selects the class with the highest probability as the predicted class label.
K-Nearest Neighbors


K-NN is a non-parametric classification algorithm that assigns a class label to a data point based on the class labels of its k nearest neighbors in the feature space. The class label is determined by majority voting among the neighbors.Random Forest: Random Forest is an ensemble learning algorithm that combines
Decision Tree


Decision Tree is a tree-based classification algorithm that recursively splits the dataset based on features to create a set of if-else decision rules. It partitions the data into subsets based on the values of features and predicts the class label based on the majority class of instances in each leaf node.
Random Forrest

Naive Bayes


Naive Bayes is a probabilistic classification algorithm based on Bayes' theorem. It assumes that the features are conditionally independent given the class label. It calculates the probability of a data point belonging to each class and selects the class with the highest probability as the predicted class label.
Support Vector Machine

SVM is a binary classification algorithm that finds an optimal hyperplane in a high-dimensional feature space to separate instances of different classes. It maximizes the margin between the hyperplane and the nearest data points of each class. SVM can also be extended to handle multi-class classification.
Xgboost


XGBoost (Extreme Gradient Boosting) is an ensemble learning algorithm that uses a gradient boosting framework. It builds a strong predictive model by combining weak models (typically decision trees) in a sequential manner. XGBoost optimizes an objective function to minimize the loss and improve the model's performance.
Evaluation
Model Validation

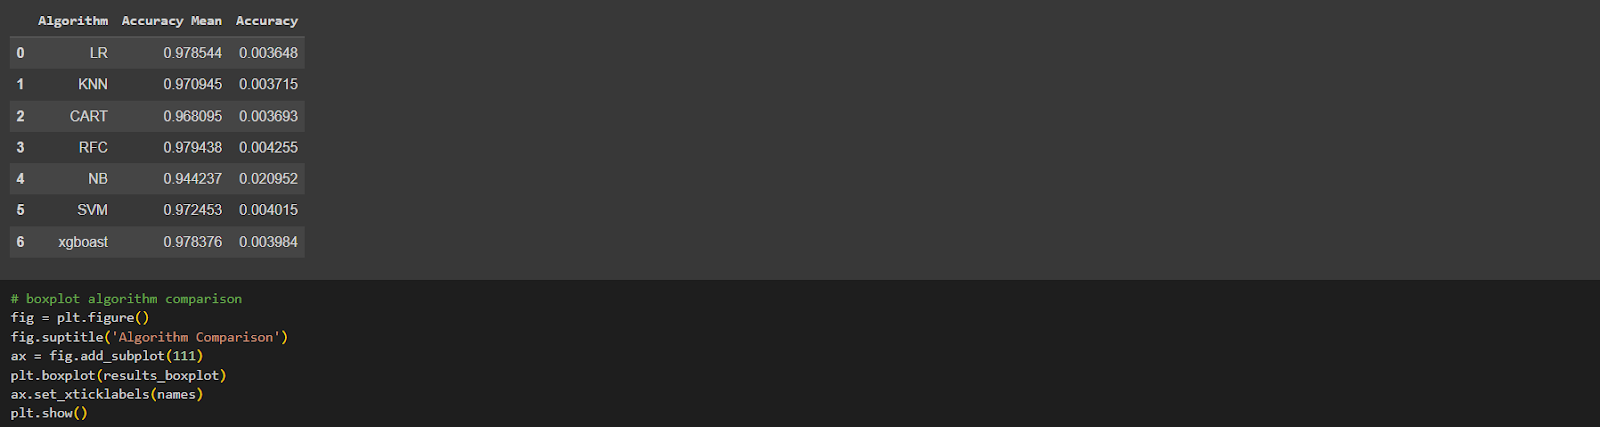
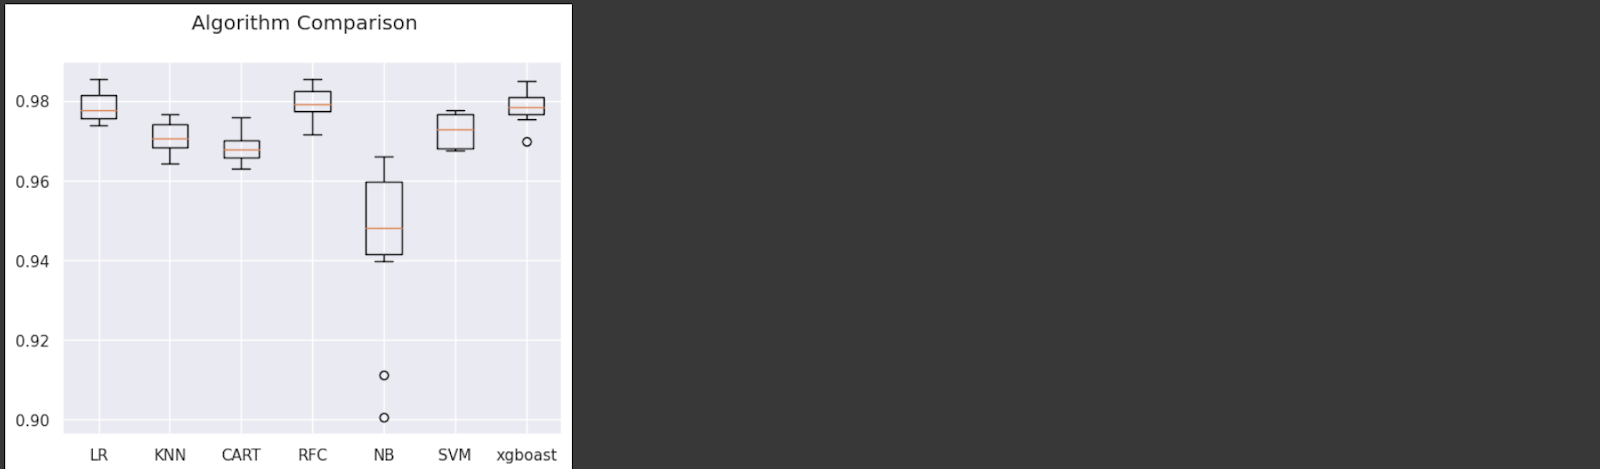
The code snippet performs cross-validation testing on multiple machine learning models, including Logistic Regression, K-Nearest Neighbors, Decision Tree, Random Forest, Naive Bayes, Support Vector Machines, and XGBoost. It calculates the mean accuracy and standard deviation of accuracy for each model using 10-fold cross-validation and displays the results in a pandas DataFrame. Cross-validation helps evaluate the models' performance and generalization ability.
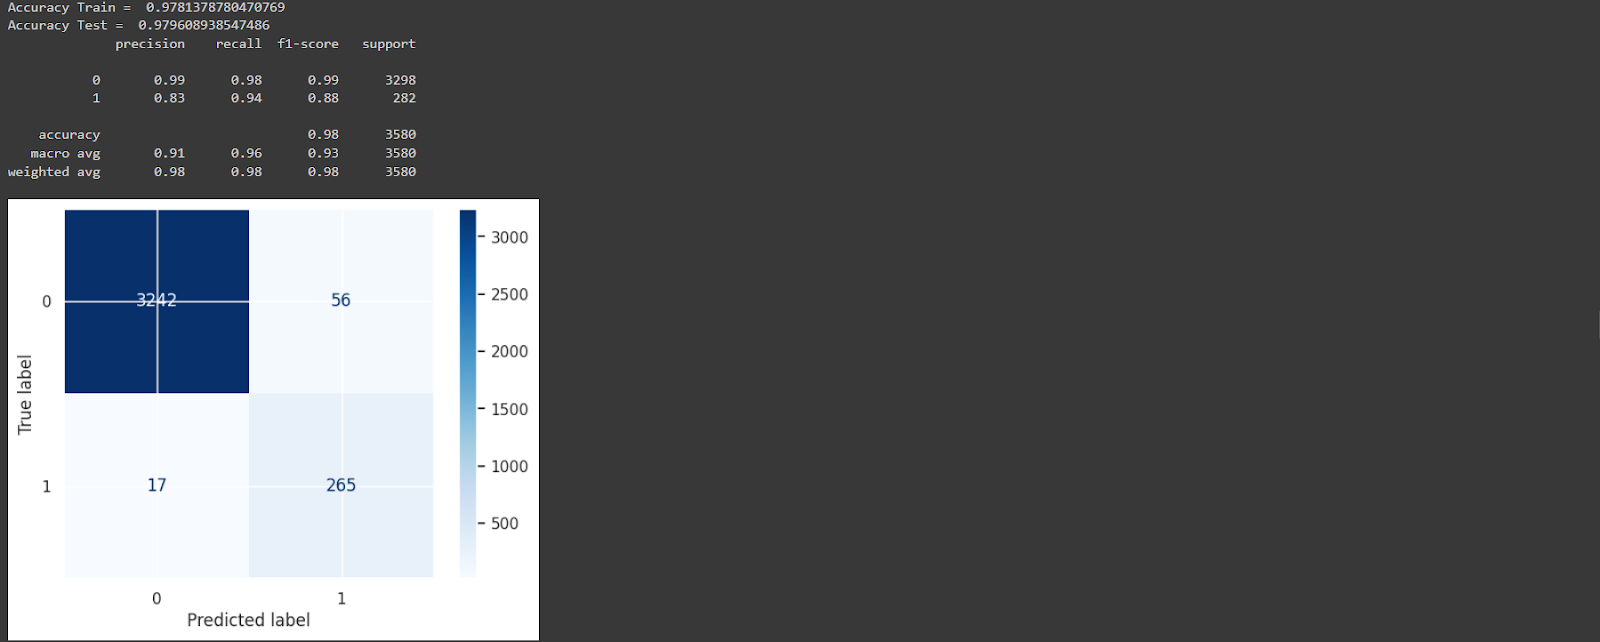
Interpretation and Interpretation of Results

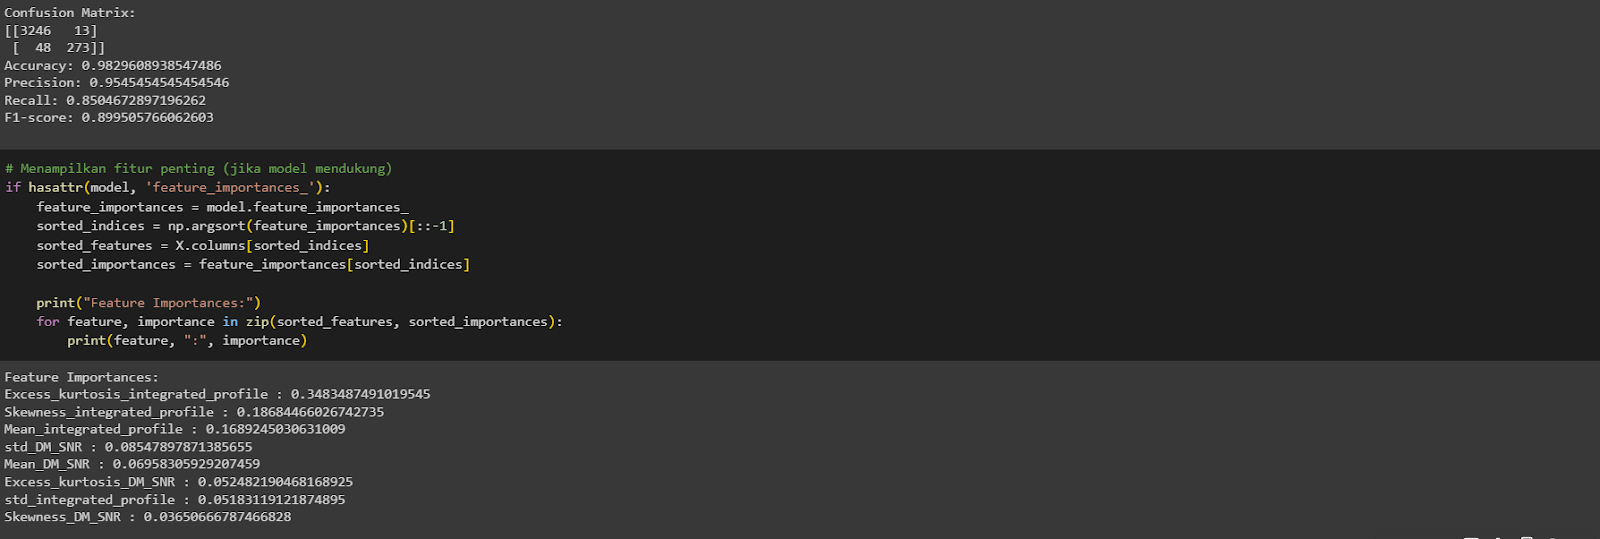

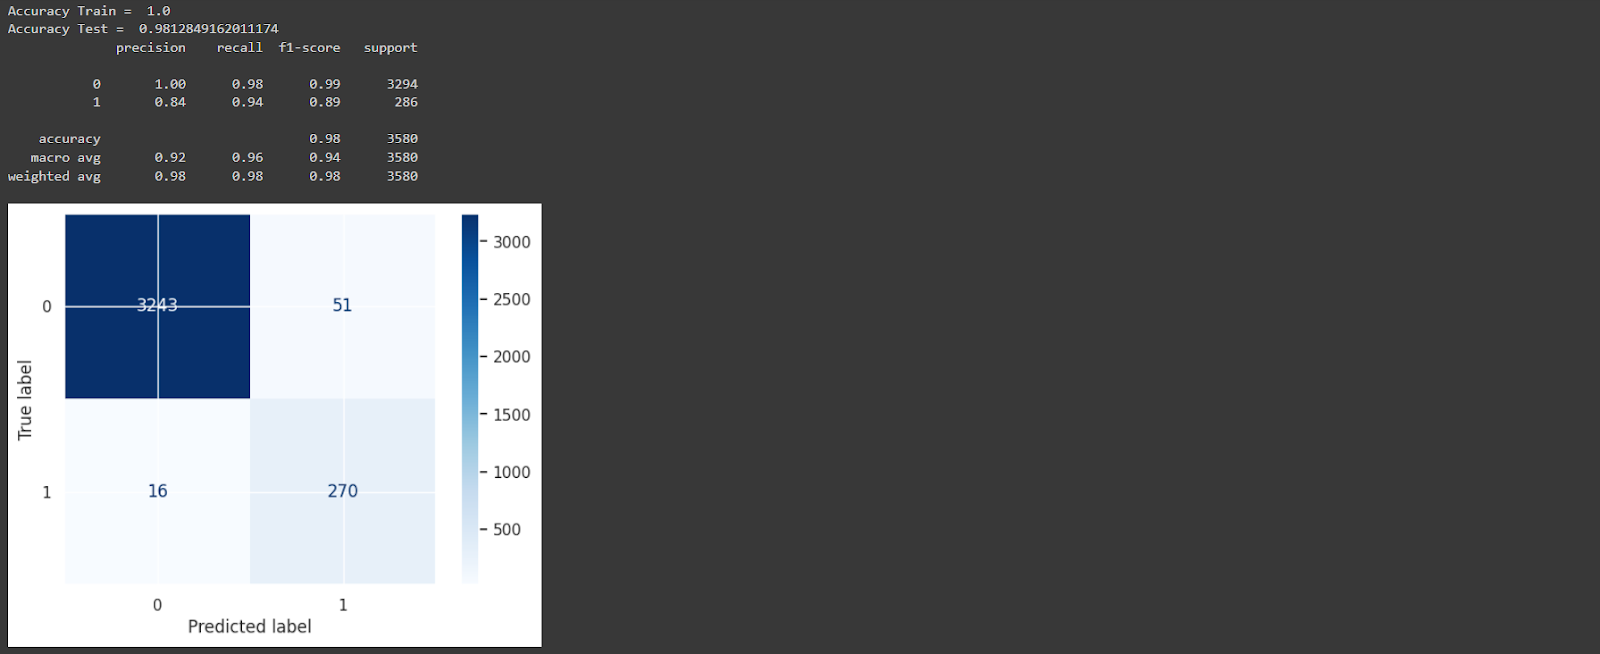
The provided information shows the evaluation results for a model applied to the dataset. The model achieved an accuracy of 0.982, indicating high overall correctness. The precision, recall (sensitivity), and F1-score are 0.955, 0.850, and 0.900, respectively. The feature importances highlight the importance of different features, with "Excess_kurtosis_integrated_profile" being the most significant. The model also shows a sensitivity of 0.850 for detecting pulsars and a specificity of 0.996 for identifying non-pulsar instances. Lastly, the model's predictions resulted in a profit of 848.47.
Eligibility Level

The code determines the eligibility level based on specific criteria. If the accuracy, precision, and recall values meet certain thresholds, the eligibility level is classified as either "High," "Reasonably High," or "Reasonable." If the values do not meet any of these criteria, the eligibility level is classified as "Low." The code then displays the determined eligibility level.
Deployment
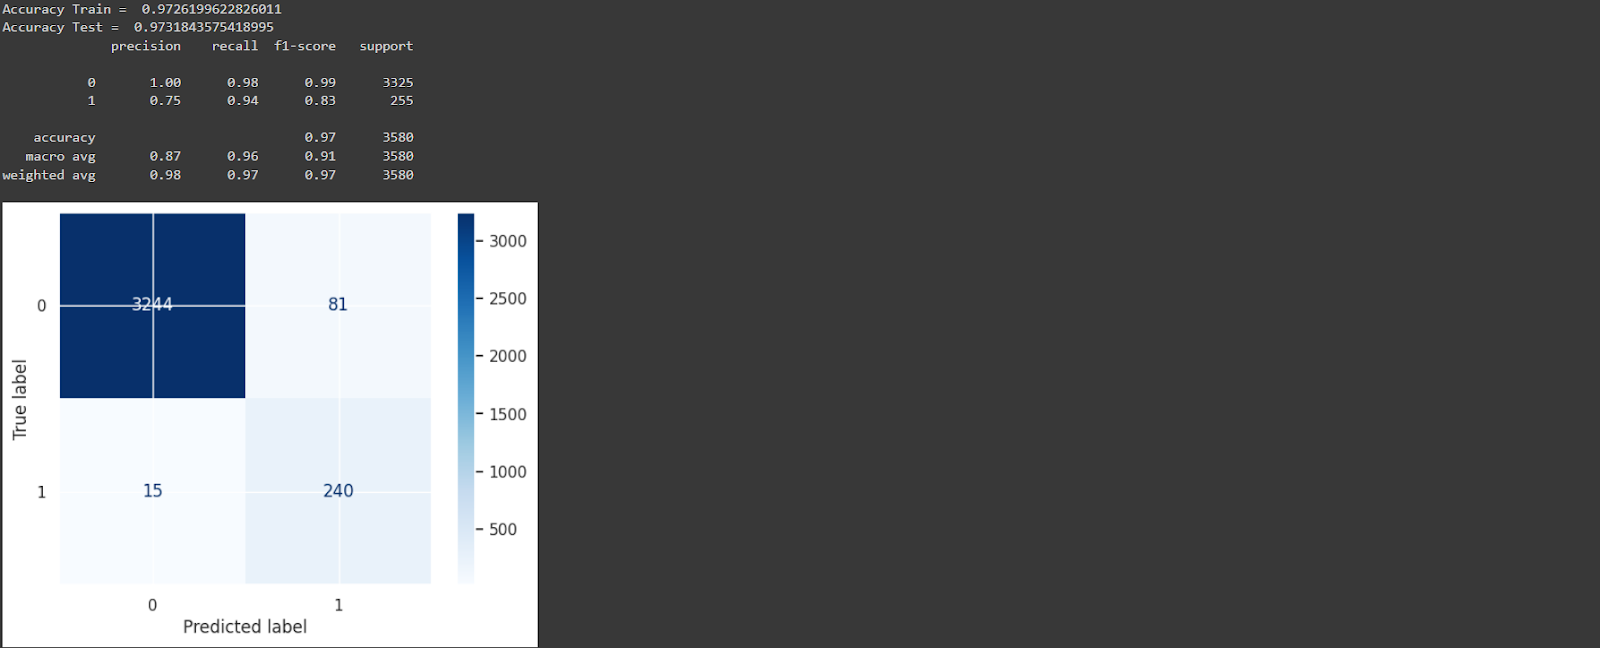
We tested LR, KNN, CART, RFC, NB, SVM and Xgboast, and also dealt with uneven data distribution and based on the results of the above algorithm. We choose random forest classifier as our prediction model. Because it shows high scores on every metric of classification performance
Informasi Course Terkait
Kategori: Artificial IntelligenceCourse: Teknologi Kecerdasan Artifisial


