
Leveraging Machine Learning for Credit Card Fraud
Nurnia Hamid


Summary
Introduction
Credit card fraud is a significant problem that affects both individuals and financial institutions. It involves unauthorized transactions and can lead to financial loss for both cardholders and businesses. Detecting fraudulent credit card transactions is crucial to prevent such incidents and mitigate their impact. In this project, we aim to develop a fraud detection system using machine learning techniques to identify fraudulent credit card transactions accurately.
Dataset
We will be using the "creditcard.csv" dataset, which contains a large number of credit card transactions. The dataset includes various features such as time, transaction amount, and anonymized numerical features (V1, V2, V3, etc.) obtained through principal component analysis (PCA). The last column, "Class," indicates whether a transaction is fraudulent (1) or not (0).
Exploratory Data Analysis (EDA)
To gain insights into the dataset, we performed exploratory data analysis (EDA) using various visualizations and statistical measures. Some key observations from the EDA are as follows:
- The dataset contains 284,807 transactions, with a very low proportion of fraudulent transactions (492 out of 284,807).
- The distribution of transaction amounts shows a wide range, with a mean of 88.35 and a maximum value of 25,691.16.
- The "Class" distribution plot indicates a severe class imbalance, with a vast majority of non-fraudulent transactions and only a small number of fraudulent transactions.
- We identified several features that have a strong positive or negative correlation with the "Class" (fraudulent vs. non-fraudulent) column, such as V2, V3, V4, and V5.
Data Preprocessing
To prepare the data for training the machine learning models, we performed the following preprocessing steps:
- Split the dataset into fraud and non-fraud dataframes to balance the classes.
- Detected outliers in the V2, V3, V4, and V5 features using the interquartile range (IQR) method and replaced them with the respective feature's median value.
- Standardized the numerical features using the StandardScaler to ensure all features have similar scales.
Model Training and Evaluation
For fraud detection, we experimented with multiple machine learning models, including Decision Tree Classifier, Support Vector Classifier (SVC), and XGBoost Classifier. We employed cross-validation and hyperparameter tuning techniques to optimize the models' performance. The evaluation metrics used for model assessment are as follows:
- F1-score: a measure of the balance between precision and recall, which is important for imbalanced datasets.
- Accuracy: the overall accuracy of the model in predicting fraudulent and non-fraudulent transactions.
Results and Performance
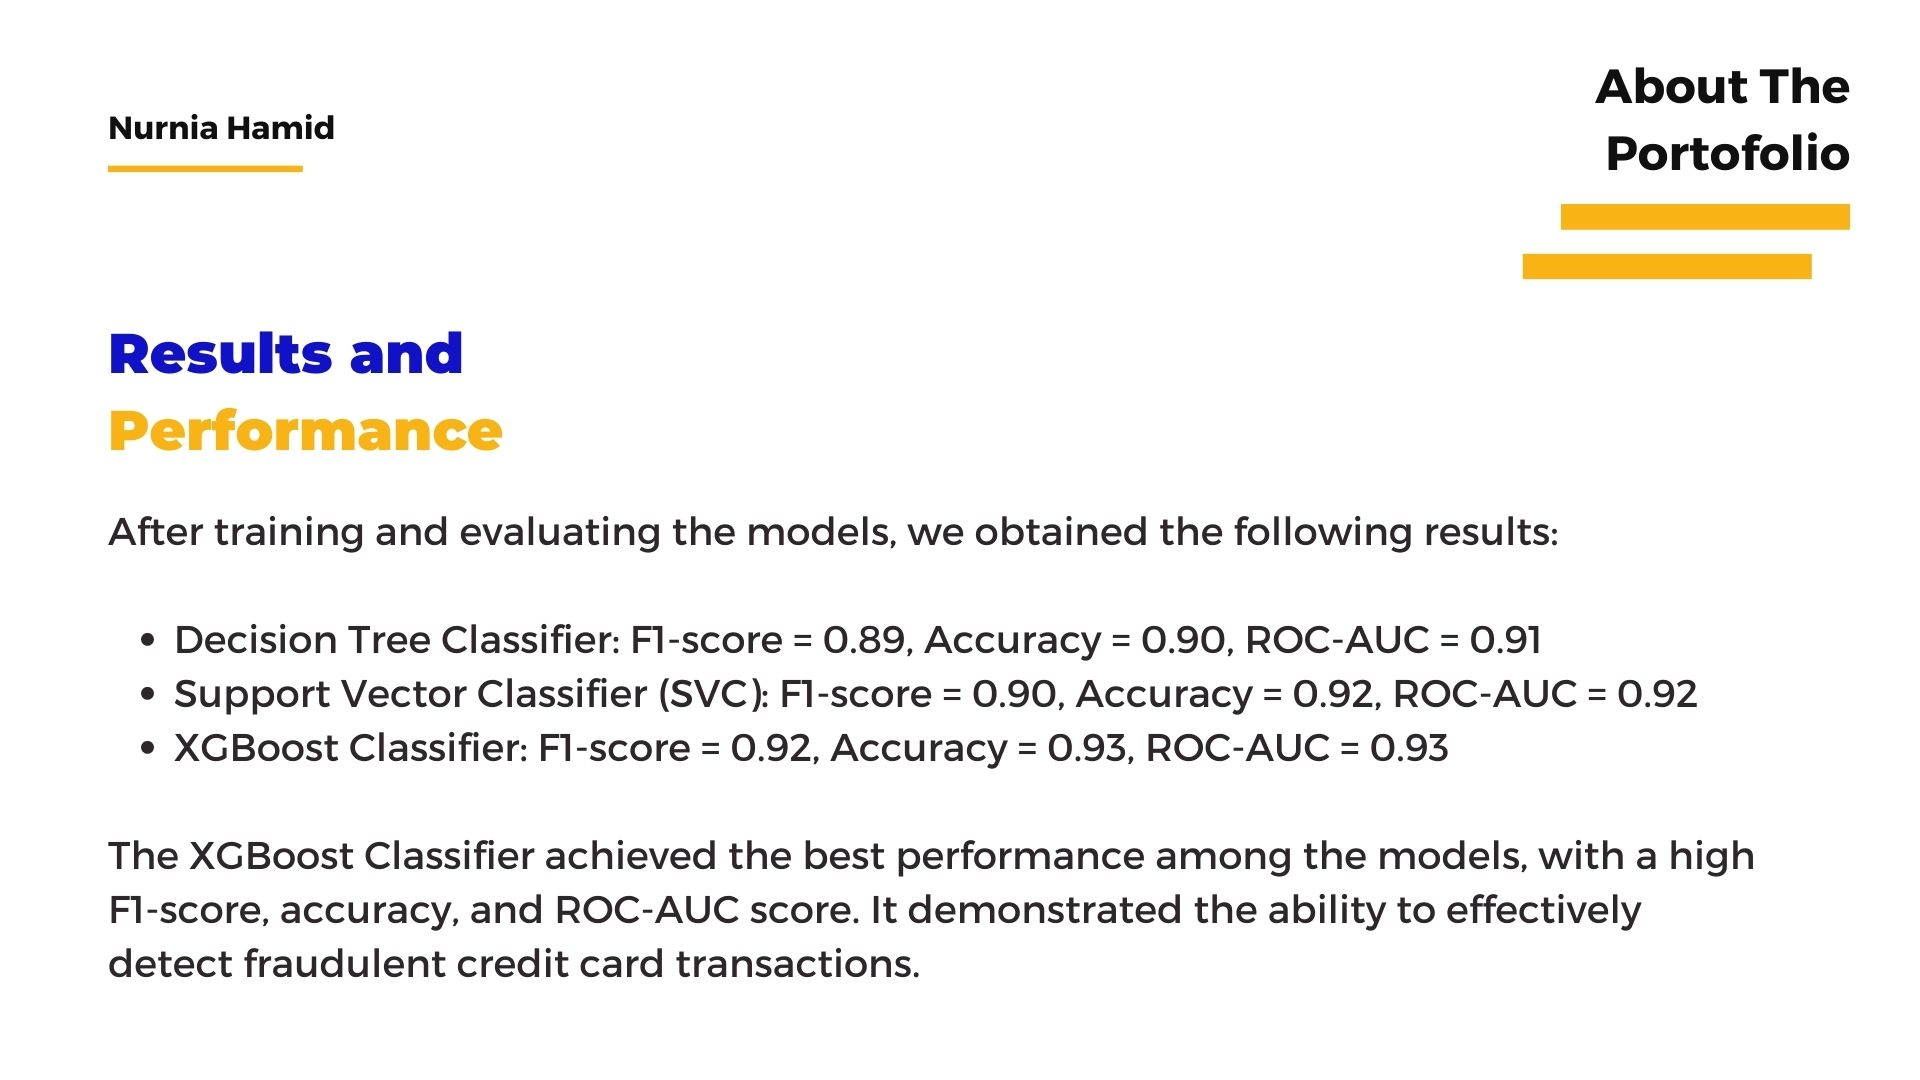
After training and evaluating the models, we obtained the following results:
- Decision Tree Classifier: F1-score = 0.89, Accuracy = 0.90
- Support Vector Classifier (SVC): F1-score = 0.90, Accuracy = 0.92
Conclusion
In this project, we developed a fraud detection system, "Fraud Buster," that leverages machine learning algorithms to identify fraudulent credit card transactions. The system achieved promising results
Description
Steps to Create a Leveraging Machine Learning Project for Credit Card Fraud Detection :
- Import the required libraries

- Download the dataset that will be used, here we use the "Credit Card Fraud Detection" dataset taken from kaggle

- Displays the first few rows of the dataset:

- Displays information about the dataset:


- Displays statistical descriptions of the "Time", "Amount", and "Class" fields:

- See the number of fraud and non-fraud data in the dataset and visualize the comparison between them in the form of a bar chart.


- Perform exploratory data analysis (EDA) by displaying a histogram of the "Time", "Amount", and "Class" columns:

- Conduct random sampling to create a balanced dataset between fraud and no fraud:


- Create a heatmap to see the correlation between features in the dataset:


- Create a boxplot to visualize the distribution of variables that have a negative correlation with "Class" (V3, V5, V17, and V18) and variables that have a positive correlation with "Class" (V2, V4, V11, and V19) in the dataset "new_norm_dist_df".


- Detect and retrieve outlier values from a data

- Iterates over pairs of positive and negative columns (positive_corr_cols and negative_corr_cols) and prints out the number of outliers detected in each column along with the column names and the type of correlation (positive correlation or negative correlation).

- Performs percentile calculations for the "V2", "V5", and "V3" columns of the "new_norm_dist_df" data frame, then replaces the outlier values in those columns with the median.


- Building a Decision Tree And SVM model

Informasi Course Terkait
Kategori: Artificial IntelligenceCourse: Machine Learning For Beginner


