
Fake News Detection using PCA
Anisah Fadhilah Putri


Summary
Fake News Detection is one of the most important issues in the digital information age, which is rich in inaccurate or misleading content. Classification algorithms can be used to classify articles or news as fake news or not.
Here I am using Passive Aggressive Classifier (PAC) classification algorithm which is used for classification tasks in Machine Learning. PAC is a useful algorithm for binary classification problems, where data is separated into two different classes. In the context of fake news detection, Passive Aggressive Classifier can be used to learn the patterns present in articles or news and classify them as fake news or not.
Description
Connecting to Google Drive

The first step when we want to read a dataset from google drive, we must connect the path that contains the dataset in it with the drive mount from the google.colab library.
Import the Required Libraries

The code above is an import of libraries and modules needed to build models and perform text analysis using the Passive Aggressive Classifier method. The following is an explanation of each part of the code:
- import numpy as np: Imports the NumPy library used for array manipulation and numerical operations.
- import pandas as pd: Imports the pandas library used to read and manipulate data in DataFrame format.
- from tensorflow.keras.models import Sequential: Imports the Sequential class from the models module in the Keras library. The Sequential class is used to build neural network models sequentially.
- from tensorflow.keras.layers import Dense, Dropout: Imports the Dense and Dropout classes from the layers module in the Keras library. The Dense class is used to add dense (fully connected) layers to the model, while the Dropout class is used to add a dropout layer that prevents overfitting.
- from sklearn.model_selection import train_test_split: Imports the train_test_split function from the model_selection module in the scikit-learn library. This function is used to split the dataset into train and test subsets.
- from sklearn.feature_extraction.text import TfidfVectorizer: Imports the TfidfVectorizer class from the feature_extraction.text module in the scikit-learn library. This class is used to convert text into feature vectors using the TF-IDF (Term Frequency-Inverse Document Frequency) method.
- from sklearn.linear_model import PassiveAggressiveClassifier: Imports the PassiveAggressiveClassifier class from the linear_model module in the scikit-learn library. This class is an implementation of the Passive Aggressive Classifier method used for data classification.
- from sklearn.metrics import accuracy_score, confusion_matrix: Import the accuracy_score and confusion_matrix functions from the metrics module in the scikit-learn library. The accuracy_score function is used to calculate prediction accuracy, while confusion_matrix is used to generate a confusion matrix that indicates classification performance.
- import os: Imports the os library used to interact with the operating system.
- for dirname, _, filenames in os.walk('/kaggle/input'): Iterates through all files and directories in /kaggle/input (the default directory in Kaggle).
- for filename in filenames: Iterates through each filename in the directory.
- print(os.path.join(dirname, filename)): Prints the full path of each file in the /kaggle/input directory.
Load the Dataset

The code above is used to load a dataset stored in a CSV file into a DataFrame object using the pandas library. The following is an explanation of each part of the code:
- df = pd.read_csv('/content/drive/MyDrive/Dataset Original or Fake News/news.csv'): Reads a CSV file containing the dataset and stores it in a DataFrame object named df. The CSV file read has the path '/content/drive/MyDrive/Real Or Fake News dataset/news.csv'.
- print(df.shape): Prints the dimensions of the dataset using the shape attribute of the DataFrame object. The shape attribute returns a tuple with two elements, the number of rows and the number of columns in the dataset.
- print(df.head()): Prints the first five rows of the dataset using the head() method. This method is useful for viewing the initial instance of the dataset and ensuring that the data has been loaded correctly.
Check For empty values in the dataset

Using the code above, we can see the number of empty values in each column of the dataset. If there are empty values, the number will be displayed next to the column name. This is useful for detecting whether the dataset has empty values that need to be addressed before performing further analysis or modeling.
- df.isnull(): This method generates a new DataFrame of the same size as df, where each cell will contain a boolean value of True if the cell is empty (missing value) and False if it is not empty.
- df.isnull().sum(): The sum() method is used to calculate the number of True values (empty values) in each column of the dataset. In this context, it returns a Series with the column name as the index and the number of empty values in each column as the value.
Import the Required Libraries

The above code is used to import the libraries required for model visualization and evaluation. The following is an explanation of each imported library:
- 'matplotlib.pyplot': This library is used to create graphical visualizations and data plots. In code, this library is most likely to be used for creating graphs.
- 'numpy': This library provides functions and tools for working with multidimensional arrays. In code, this library is most likely used to perform manipulations and operations on arrays.
- 'seaborn': This library is a Python library based on matplotlib. Seaborn is used to create attractive and informative statistical plots. In code, this library will likely be used to create more interesting and informative graph visualizations.
- 'sklearn.metrics.confusion_matrix': This module provides a function to calculate the confusion matrix. The confusion matrix is used to evaluate the performance of a classification model by comparing the model's predictions with the true values. In code, the 'confusion_matrix' function of this module can be used to calculate the confusion matrix in model evaluation.
Pre-Processing

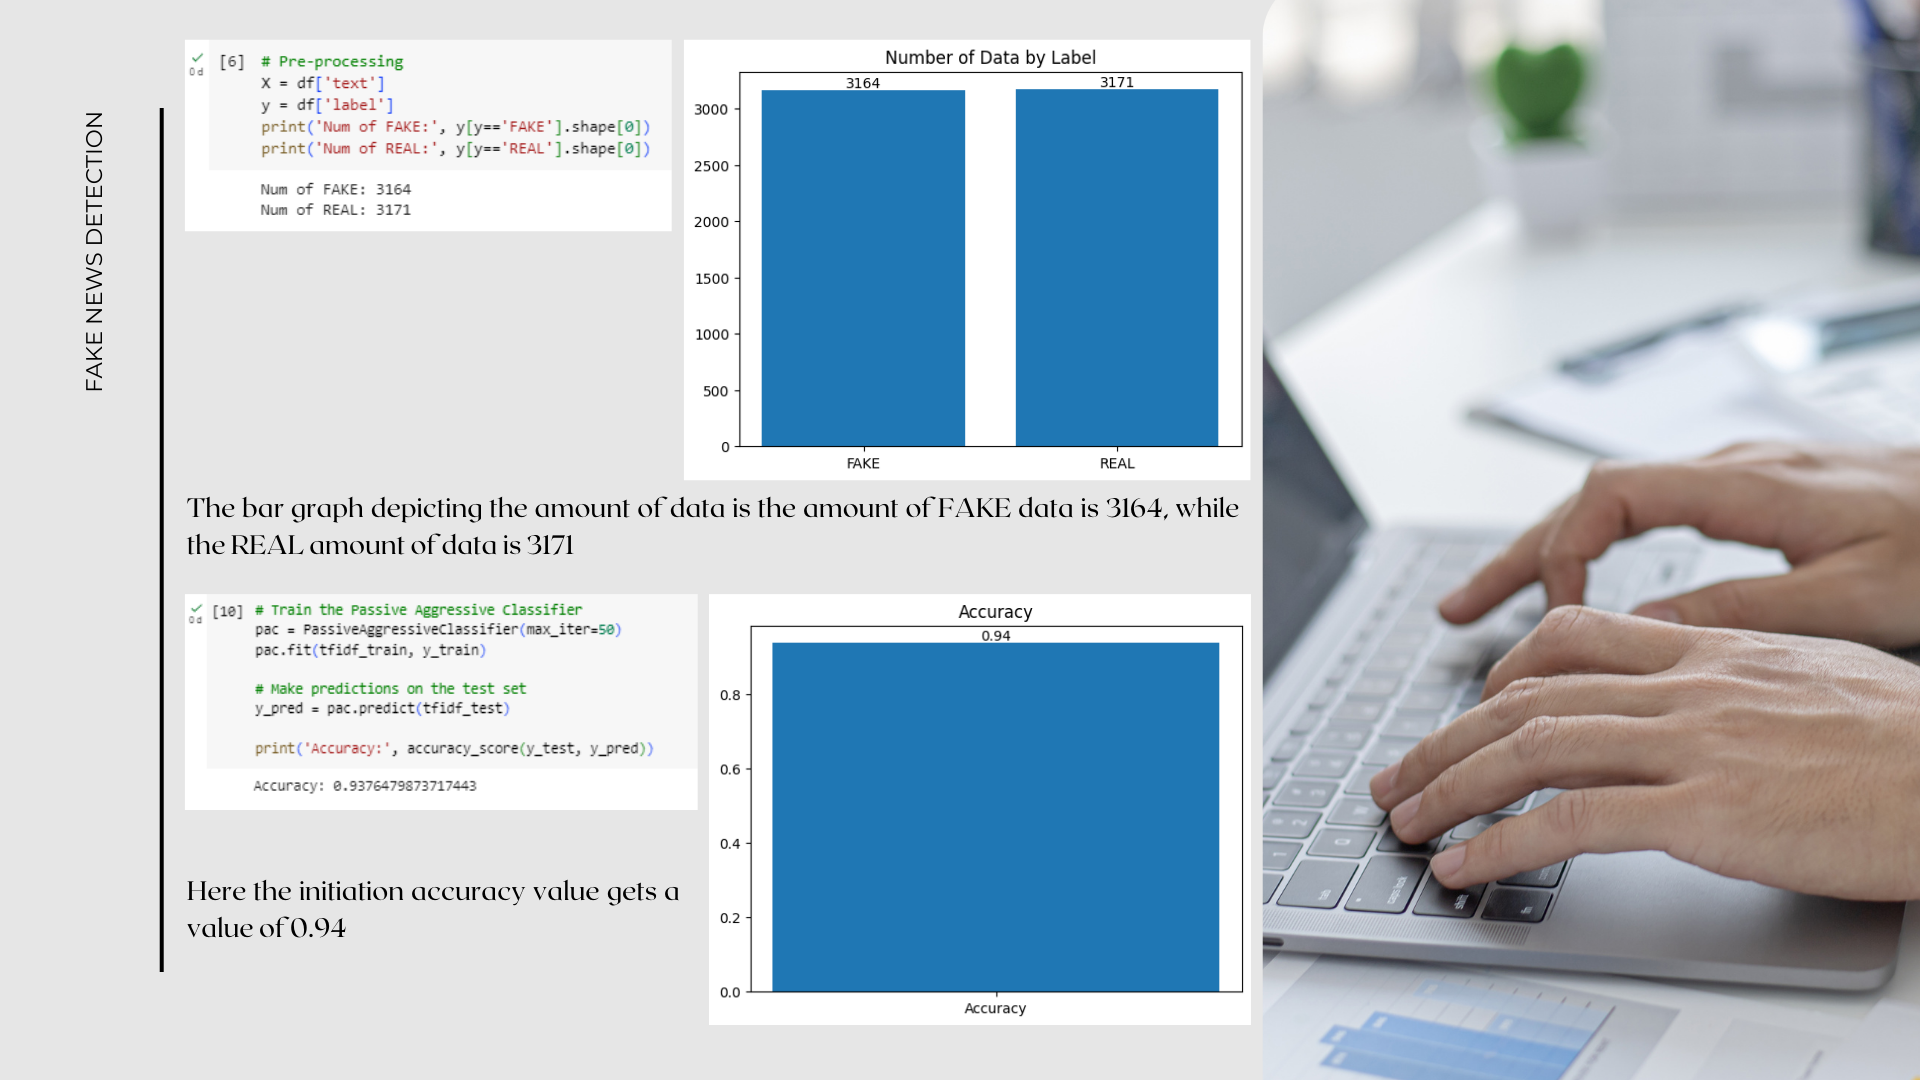
With this code, we can split the dataset into two parts: X which contains the news text, and y which contains the classification labels. Then, we can use X and y as inputs to train the classification model. In addition, the code also prints the number of news stories with 'FAKE' and 'REAL' labels to provide information about the label distribution in the dataset.
- X = df['text']: The variable X is filled with the 'text' column of the dataset df. The 'text' column contains the text of each news story.
- y = df['label']: Variable y is filled with the 'label' column of dataset df. The 'label' column contains the classification label for each news story, which is 'FAKE' (fake news) or 'REAL' (real news).
- print('Num of FAKE:', y[y=='FAKE'].shape[0]): This line prints the number of stories with the label 'FAKE'. Using y[y=='FAKE'] will filter only news with the label 'FAKE', then shape[0] is used to retrieve the number of rows in the filter result.
- print('Num of REAL:', y[y=='REAL'].shape[0]): This line prints the number of news with the label 'REAL'. Using y[y=='REAL'] will filter only news with the label 'REAL', then shape[0] is used to retrieve the number of rows in the filter result.


The bar graph depicting the amount of data is the amount of FAKE data is 3164, while the REAL amount of data is 3171
Split the dataset into training and testing sets

The code uses the train_test_split method with the argument X as the dataset feature and y as the dataset label. Then here I also provide the argument test_size=0.2 to determine the test size of 20% of the entire dataset. In addition, I provide the argument random_state=123 to ensure consistent dataset splitting results every time the code is run. After this code, it appears to have four variables: X_train (training data features), X_test (testing data features), y_train (training data labels), and y_test (testing data labels).
With this step, the dataset has been divided into training and testing data subsets that can be used to train and test the fake news detection model.
Vectorize the text data using TF-IDF

Here I created a TfidfVectorizer object with parameters stop_words = 'english' to remove common words in English, and max_df = 0.6 to remove words that appear in more than 60% of the documents.
Then, proceed to use the fit_transform method on the X_train training data to learn the vocabulary of the training data and transform it into a TF-IDF matrix. Next, use the transform method on the test data X_test to transform it into a TF-IDF matrix with the same vocabulary that has been learned from the training data.
Train the Passive Aggressive Classifier

Here I created a PassiveAggressiveClassifier object with the parameter max_iter=50 which indicates the maximum number of iterations used in the learning process. Then, we train the model using fit method with TF-IDF matrix of training data tfidf_train and label y_train.
After the model is trained, we continue to use the predict method to make predictions on the tfidf_test test data and store the prediction results in the y_pred variable. Finally, then score the prediction accuracy using the accuracy_score method from the scikit-learn library by comparing the actual label y_test with the predicted label y_pred.
With this step, the model has been trained and tested to perform classification on text data using the Passive Aggressive approach, and the prediction accuracy is printed.


Here the initiation accuracy value gets a value of 0.94
Confusion Matrix

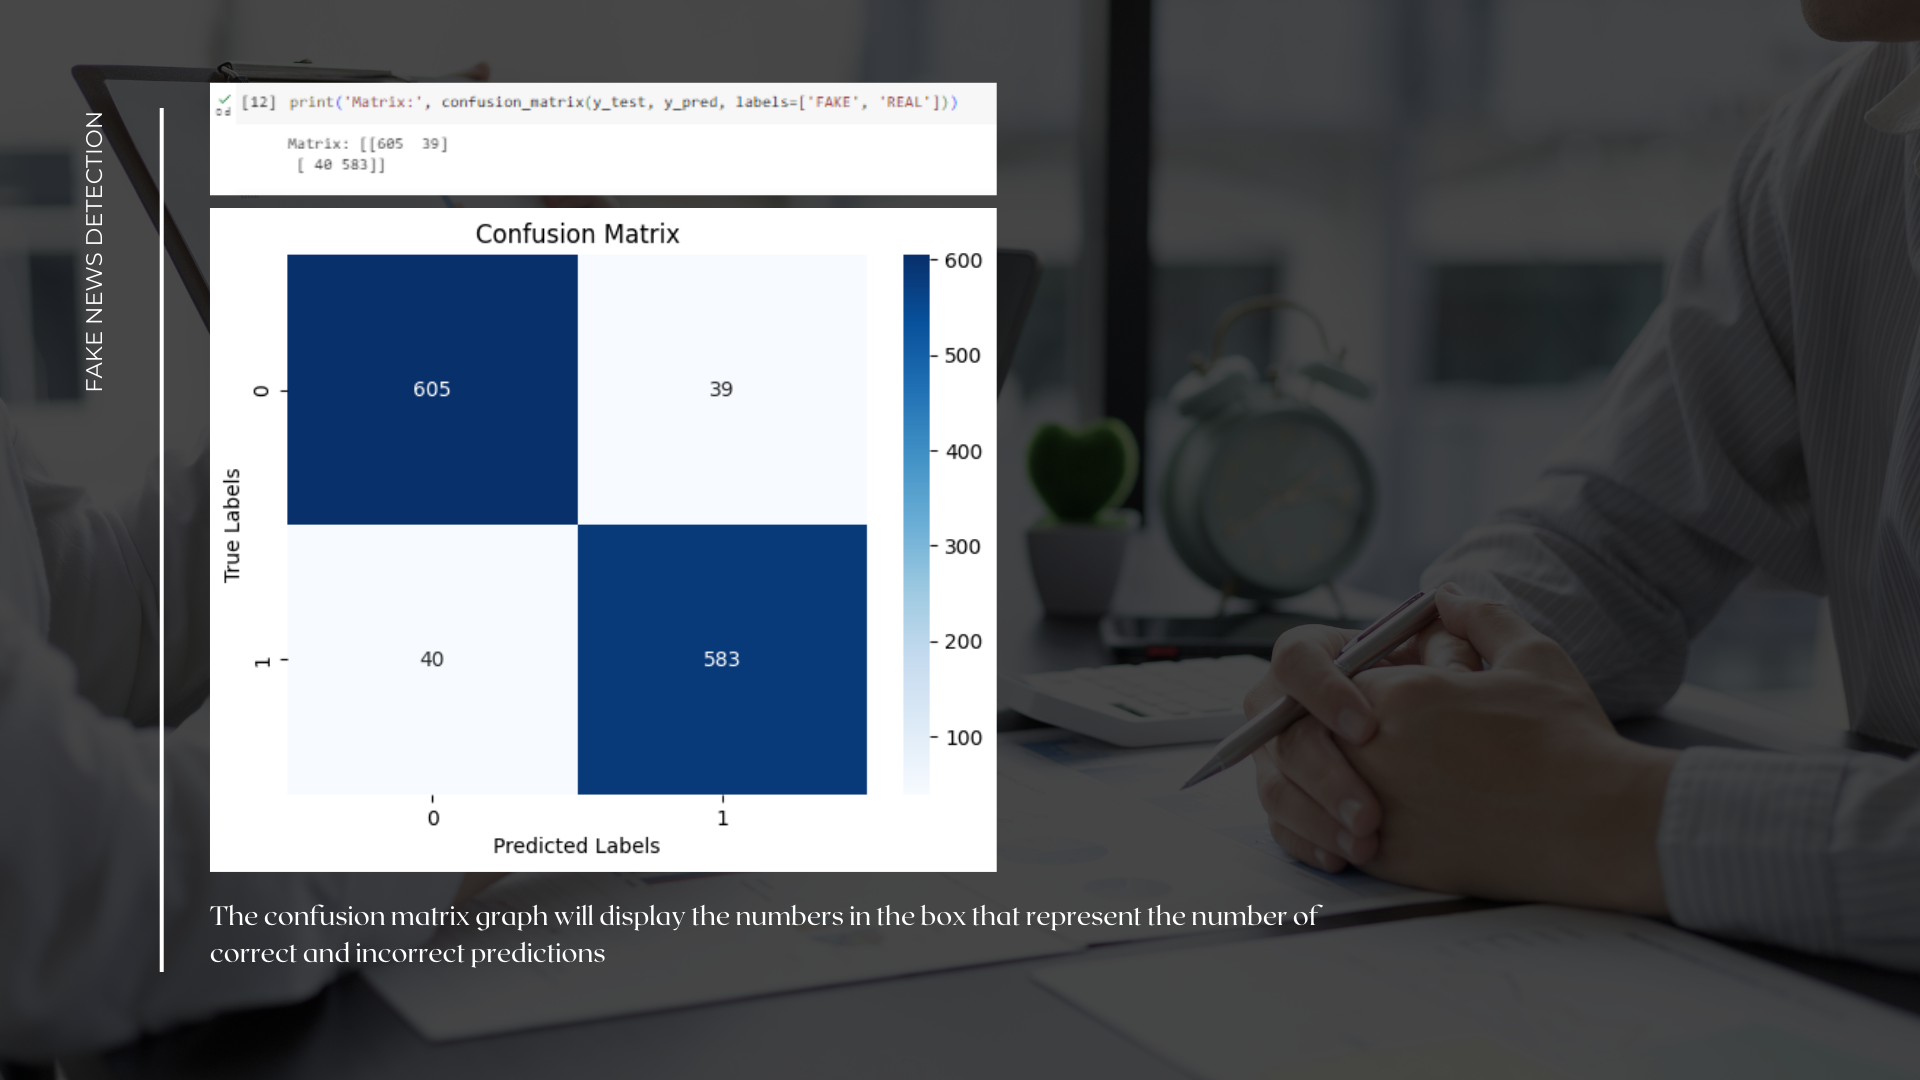
Here I use the confusion_matrix method with the argument y_test as the actual label and y_pred as the prediction label. And also give the argument labels=['FAKE', 'REAL'] to determine the order of the classes that will be displayed in the confusion matrix. The result will print a confusion matrix consisting of four values: true negative (TN), false positive (FP), false negative (FN), and true positive (TP), with the class order 'FAKE' and 'REAL'.
With this step, I can view and print the confusion matrix to evaluate the model's performance in fake news detection.


The confusion matrix graph will display the numbers in the box that represent the number of correct and incorrect predictions
Informasi Course Terkait
Kategori: Artificial IntelligenceCourse: Teknologi Kecerdasan Artifisial


