
Predictive Analysis of Bank Client Subscribe
Ahmad Syafei Nursuwanda

Summary
Abstract
The data is related to direct marketing campaigns (phone calls) of a Portuguese banking institution. The classification goal is to predict if the client will subscribe a term deposit (variable y).
Description
Project Overview
The data is related with direct marketing campaigns of a Portuguese banking institution. The marketing campaigns were based on phone calls. Often, more than one contact to the same client was required, in order to access if the product (bank term deposit) would be ('yes') or not ('no') subscribed. The dataset is from kaggle and there is the dataset:
- bank-additional-full.csv with all examples (41188) and 20 inputs, ordered by date (from May 2008 to November 2010), very close to the data analyzed in [Moro et al., 2014]
The smallest datasets are provided to test more computationally demanding machine learning algorithms (e.g., SVM). The classification goal is to predict if the client will subscribe (yes/no) a term deposit (variable y).
1. Import Libraries
Import required libraries (mengimport beberapa library yang akan digunakan)
# Data Processing
import pandas as pd
import numpy as np
# tools visualisasi
import matplotlib as mpl
import matplotlib.pyplot as plt
import seaborn as sns
# Machine Learning Process
from sklearn.model_selection import train_test_split
from sklearn.preprocessing import LabelEncoder, normalize, StandardScaler
from sklearn.linear_model import LogisticRegression
from sklearn.neighbors import KNeighborsClassifier
from sklearn import svm
from sklearn import tree
from sklearn.ensemble import RandomForestClassifier
from sklearn.naive_bayes import GaussianNB
from sklearn.metrics import accuracy_score
from sklearn.metrics import confusion_matrix
from sklearn.metrics import classification_report
from sklearn.impute import SimpleImputer
from sklearn import metrics
import statsmodels.api as sm
%matplotlib inline
2. Exploring and Preprocessing Dataset


Make an atribute group by the type of data

Deskriptif sstatistics for numerical column

Analysis: The Additional Bank has a data dimension of 41188 rows and 21 columns. It can be seen that in the dataset info section there are no missing values, which I will examine later in the next section. The training data has 36548 labels "no" and 4640 labels "yes"
Data Cleaning


For categorical data, the missing values will be filled with the mode (modus), while for numerical data, the missing values will be filled with the median.

Double check the amount of NaN (missing values)

Rename kolom

Analysis: It can be seen in the pdays attribute that there is a value of 999 which indicates that the client was not previously contacted. This number can be replaced with a value of 0. After examining the number of nan (missing values) in the dataframe, it turns out that only categorical data contains missing values and numerical data does not contain missing values. After imputation, there are no missing values left
3. Visualization Data
In this section, I'll do a simple visualization of the data
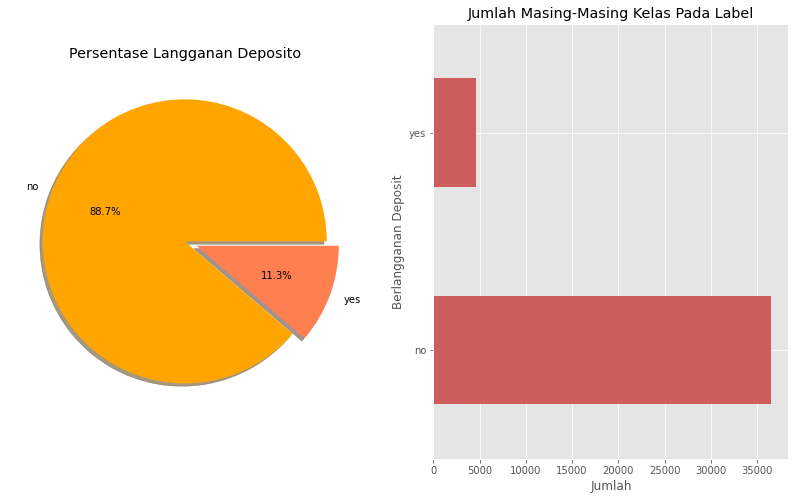
- visualization based on the amount of data in the deposit column


Conclusion: It can be seen in the visualization above that the value no has a total of about 7x more than the value yes. So, there is an inequality in the number of each value contained in the class label.
Question
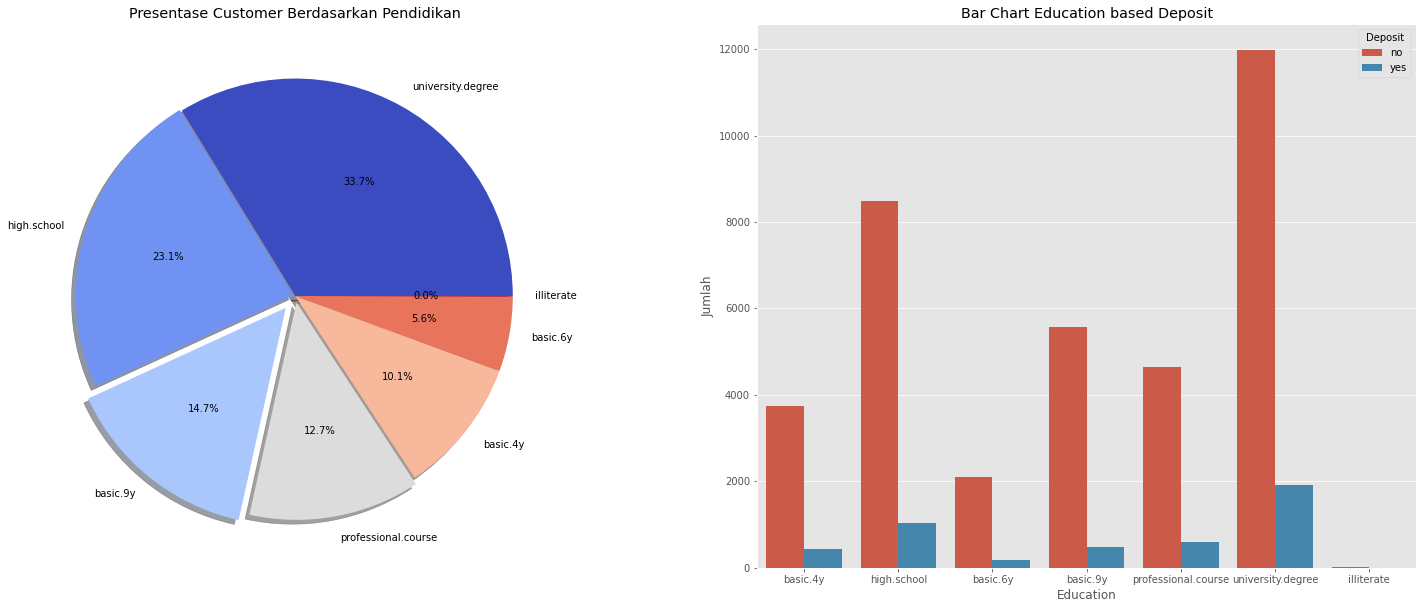
2. visualization based on the education column with the amount of data in the deposit column


Conclusion: It can be seen from the visualization above that the data is dominated by the university degree education category. This education category provides the highest number of deposit subscriptions for 'No' and 'Yes' classes compared to the other 5 education categories.
4. Pemodelan
In this section, I will select features and targets as well as perform data splitting and a scaler will be carried out. The purpose of doing this scaler is to avoid the occurrence of outliers in making the model later. The Machine Learning classification model used in this task is:
- Logistic Regression
- KNN
- SVM
- Decision Tree
- Random Forest
- Naive Bayes


1). Logistic Regression
In this section, I will implement logistic regression with scikit-learn


Conclusion: It can be seen by using Logistic Regression modeling, the results of the prediction accuracy are 90.8% (0.9083515416363195) with the following numbers:
- True Negatif (TN) = 7091
- False Positif (FP) = 203
- False Negatif (FN) = 552
- True Positif (TP) = 392
It can be said that the results of the accuracy are quite good with a value of 90.8%
2). K-Nearest Neighbors (KNN)
In this part, I will implement K-Nearest Neighbors (KNN) with scikit-learn


Conclusion: It can be seen by using the K-Nearest Neighbors (KNN) modeling, the prediction accuracy results are 90.1% (0.9010682204418549) with the following numbers:
- True Negatif (TN) : 7038
- False Positif (FP) : 256
- False Negatif (FN) : 559
- True Positif (TP) : 385
It can be said that the results of the accuracy are quite good with a value of 90.1%.
3). Support Vector Machine (SVM)
In this part, I will implement Support Vector Machine (SVM) with scikit-learn


Conclusion: It can be seen by using the Support Vector Machine (SVM) modeling, the prediction accuracy results are 90.6% (0.9061665452779801) with the following numbers:
- True Negatif (TN) : 7142
- False Positif (FP) : 152
- False Negatif (FN) : 621
- True Positif (TP) : 323
It can be said that the results of the accuracy are quite good with a value of 90.6%
4). Decision Tree
In this part, I will implement a Decision Tree with scikit-learn


Conclusion: It can be seen by using the Decision Tree modeling, the results of the prediction accuracy are 88.7% (0.8874726875455208) with the following numbers:
- True Negatif (TN) : 6794
- False Positif (FP) : 500
- False Negatif (FN) : 439
- True Positif (TP) : 505
It can be said that the results of the accuracy are quite good with a value of 88.7%
5). Random Forest
In this part, I will implement Random Forest with scikit-learn


Conclusion: It can be seen by using the Random Forest modeling that the prediction accuracy results are 91.4% (0.9142995872784656) with the following numbers:
- True Negatif (TN) : 7091
- False Positif (FP) : 203
- False Negatif (FN) : 552
- True Positif (TP) : 392
It can be said that the results of the accuracy are quite good with a value of 91.4%
6). Naive Bayes
In this part, I will implement Naive Bayes with scikit-learn


Conclusion: It can be seen by using the Naive Bayes modeling, the prediction accuracy results are 72.3% (0.7232337946103423) with the following numbers:
- True Negatif (TN) : 5175
- False Positif (FP) : 2119
- False Negatif (FN) : 161
- True Positif (TP) : 783
It can be said that the accuracy results are quite low with a value of 72.3% because this value when compared to other models is quite far from the accuracy value.
11. Overall Analysis (Algorithm Analysys)

Modeling with the Best Accuracy Value
Based on the analysis of several models that have been done, it can be concluded that the model that produces the best accuracy or predictive value is modeling using the Random Forest method. The accuracy value obtained is 91.4% (0.9142995872784656).
Modeling with the Lowest Accuracy Value
For modeling results with the lowest accuracy or predictive value, namely modeling using Naive Bayes. The value obtained is 72.3% (0.7232337946103423). When compared to other models, the comparison is quite far where other models have an accuracy of around 88% - 92%.
Conclusion
So, for the bank-additional-full.csv dataset related to direct marketing campaigns (phone calls) of a Portuguese banking institution. To predict whether a client will subscribe (yes/no) to a term deposit (variable y), then the appropriate modeling is to use the Random Forest model.
Reference
https://www.kaggle.com/datasets/sahistapatel96/bankadditionalfullcsv
https://github.com/syaide11/H8_Batch_10/tree/main/PYTN_Assgn_3_10_Syaima%20Radestya/dataset
Informasi Course Terkait
Kategori: Data Science / Big DataCourse: Machine Learning Dengan Scikit Learn Python
