Depression Classification
Maulana Muhammad
Summary
Depression is a mood disorder that causes a persistent feeling of sadness and loss of interest. Also called major depressive disorder or clinical depression, it affects how you feel, think and behave and can lead to a variety of emotional and physical problems.
Description
Depression is a mood disorder that causes a persistent feeling of sadness and loss of interest. Also called major depressive disorder or clinical depression, it affects how you feel, think and behave and can lead to a variety of emotional and physical problems. You may have trouble doing normal day-to-day activities, and sometimes you may feel as if life isn't worth living.
More than just a bout of the blues, depression isn't a weakness and you can't simply "snap out" of it. Depression may require long-term treatment. But don't get discouraged. Most people with depression feel better with medication, psychotherapy or both.
Although depression may occur only once during your life, people typically have multiple episodes. During these episodes, symptoms occur most of the day, nearly every day and may include:
- Feelings of sadness, tearfulness, emptiness or hopelessness
- Angry outbursts, irritability or frustration, even over small matters
- Loss of interest or pleasure in most or all normal activities, such as sex, hobbies or sports
- Sleep disturbances, including insomnia or sleeping too much
- Tiredness and lack of energy, so even small tasks take extra effort
- Reduced appetite and weight loss or increased cravings for food and weight gain
- Anxiety, agitation or restlessness
- Slowed thinking, speaking or body movements
- Feelings of worthlessness or guilt, fixating on past failures or self-blame
- Trouble thinking, concentrating, making decisions and remembering things
- Frequent or recurrent thoughts of death, suicidal thoughts, suicide attempts or suicide
- Unexplained physical problems, such as back pain or headaches
For many people with depression, symptoms usually are severe enough to cause noticeable problems in day-to-day activities, such as work, school, social activities or relationships with others. Some people may feel generally miserable or unhappy without really knowing why.
To find out about this depression problem, i decided to make machine learning classification with three different as comparison, including Decision Tree, Naive Bayes & K-Nearest Neighbor.
why do I use these three algorithms?
Decision Tree
- Decision tree usually imitate human thinking abilities when making decision, so they are easy to understand.
Naive Bayes
- It is simple and easy to implement. It doesn't require as much training data. It handles both continuous and discrete data. It is highly scalable with the number of predictors and data points.
K-Nearest Neighbor
- The KNN algorithm can compete with the most accurate models because it makes highly accurate predictions.
Depression Classification
Machine Learning Algorithm Comparison
Decision Tree, Naive Bayes & K-Nearest Neighbor
Explanation :
For Machine Learning Classfification, i use google colab because the application only require internet connection without needing to be installed on personal computer.
Google Colab : https://colab.research.google.com
After that, i searched fot datasets that i going to use on kaggle.
Kaggle : https://kaggle.com
Datasets : https://www.kaggle.com/datasets/diegobabativa/depression
Then go into classification process :
First connect google.colab with google drive because data that will be used later will be accessed via google drive.
Upload downloaded data to dataset folder on Google Drive.
Google Drive : https://drive.google.com/
Then import library that will be used for classification, machine learning models, data splitting, and model evaluation.
Access datasets that have been obtained on Kaggle, file name is b_depressed, then display first five data from the dataset.
Preprocessing
Now we enter the data preprocessing stage, first check whether there are missing values in the dataset.
Drop missing value from datasets.
Check missing value again, if there no data missing, proceed to the next process.
Check lot of data based on feature ‘sex’.
Then I deleted feature Survey_id & Ville_id because I thought these two features had no effect on classification.
Check data info, which will be displayed are Column, Non-Null Count, and Data Type.
Then check correlation between data, visualize it with seaborn.
It can be seen in the correlation visualization above, the average data is found in the Low Positive Correlation & Low Negative Correlation.
Check number of Sex features, here you can see that the number is 1 or there are more men than women.
Check again for the Age feature, it can be seen that the average age of the depression data ranges from 20-30 years old.
Then check for the married feature, it can be seen that most of the depression data are married people.
Check the amount of data that will be used as a class later.
Separate feature and class, feature on x & class on y.
Feature x
- sex
- Age
- Married
- Number_children
- education_level
- total_members
- gained_asset
- durable_asset
- save_asset
- living_expenses
- other_expenses
- incoming_salary
- incoming_own_farm
- incoming_business
- incoming_no_business
- incoming_agricultural
- farm_expenses
- labor_primary
- lasting_investment
- no_lasting_investmen
Class y
- Depressed
Splitting data into train data & test data using train_test_split.
Modelling
Decision Tree
Enter the modeling, here I use Decision Tree, Naïve Bayes and K-Nearest Neigbor algorithms as accuracy comparison.
Here I am doing Decision Tree model training using Gini Index, random_state 100, max depth decision tree 5 and min samples leaf is 5.
Then I tested Decision Tree model with x_test.
Match it with actual data.
Then I evaluation the model, I use confusion matrix and classification report & accuracy score.
Confusion matrix
- True Positive : The model predicted positive, and the real value is positive.
- True Negative : The model predicted negative, and the real value is negative.
- False Positive : The model predicted positive, but the real value is negative (Type I error).
- False Negative : The model predicted negative, but the real value is positive (Type II error).
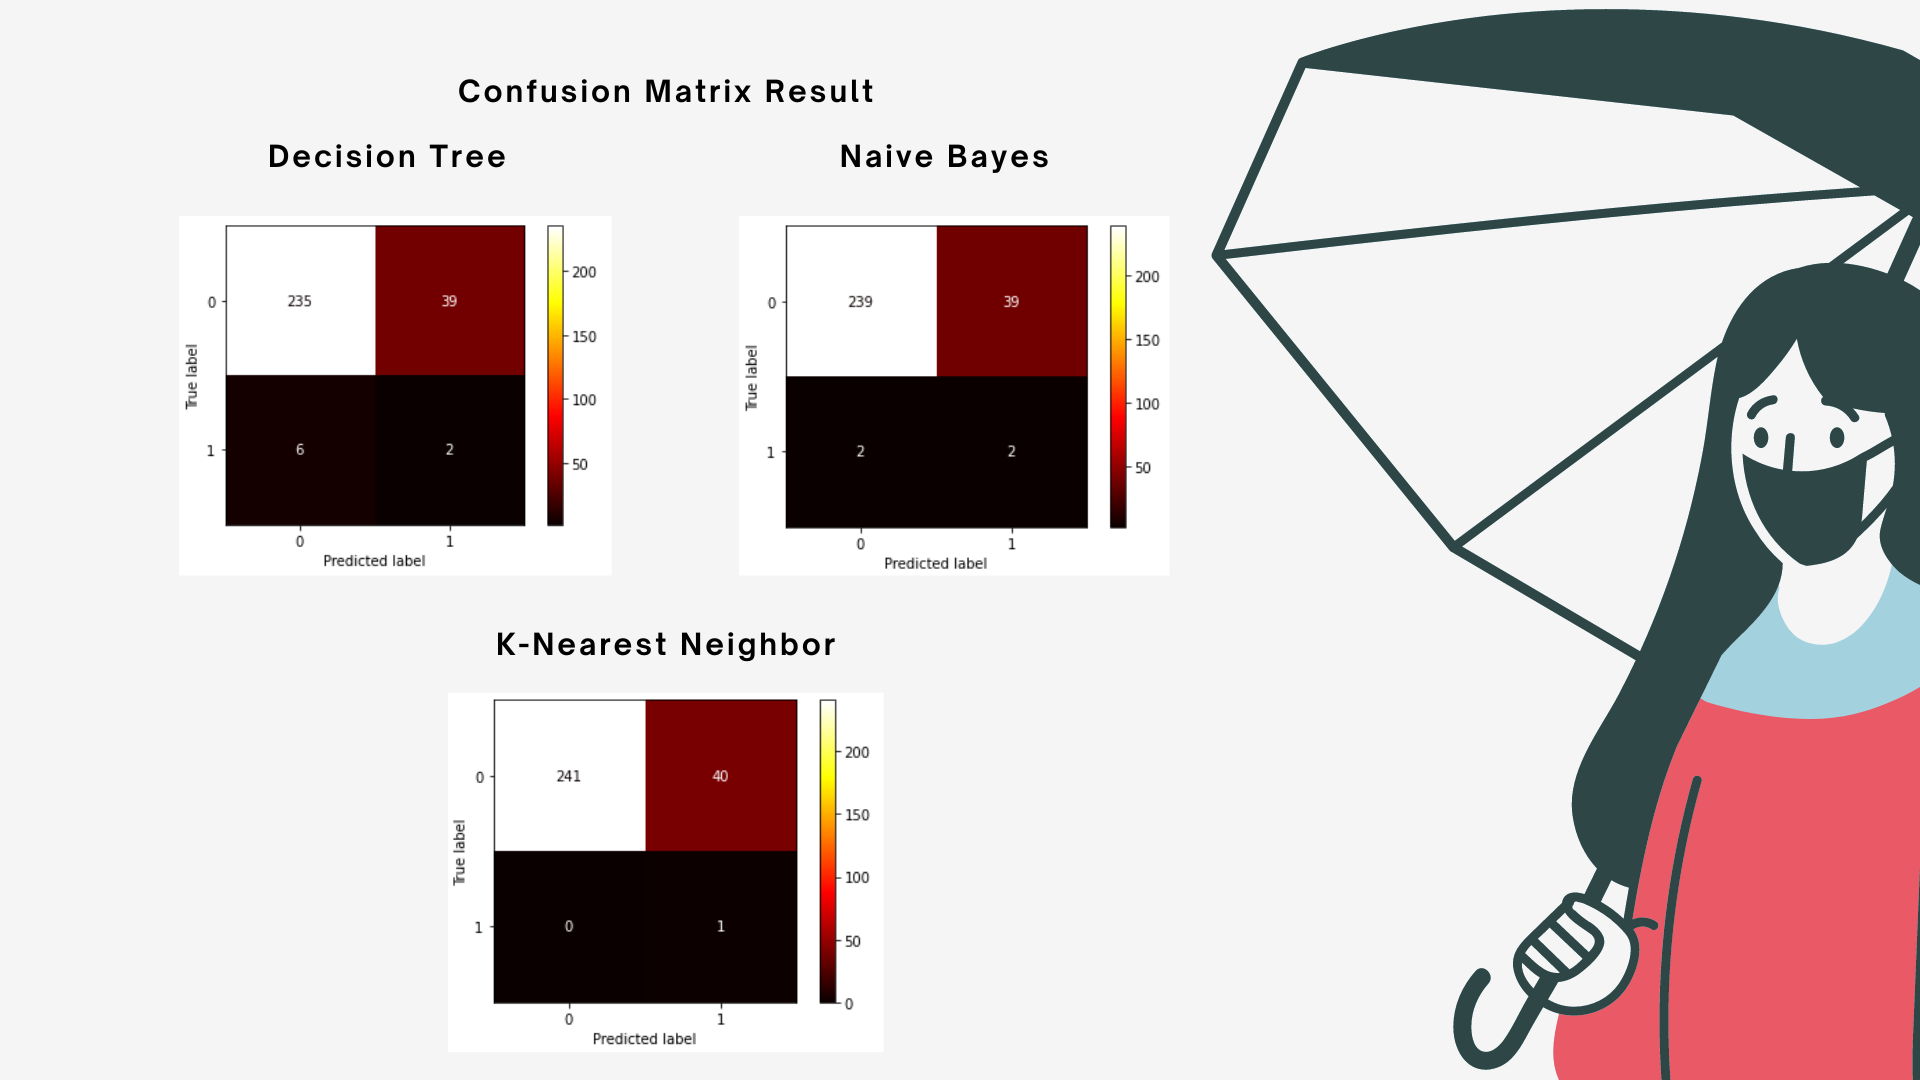
On that confusion matrix can be seen :
- True Positive : 2
- False Positive : 39
- False Negative : 6
- True Negative : 235
It can be concluded that the results of the confusion matrix are good because the average data enters True Negative values.
Classification Report
Accuracy : The accuracy returns the proportion of correct predictions.
Accuracy = (TP + TN) / (TP + TN + FP + FN)
Precision : The precision returns the proportion of true positives / negative among all the values predicted as positive / negative.
Precision = TP / (TP + FP)
Recall : The recall returns the proportion of positive / negative values correctly predicted.
Recall = TP / (TP + FN)
F1-Score : The f1-score is the harmonic mean of precision and recall. It is often used to compare classifiers.
F1-score = (2 x Precision x Recall) / (Precision + Recall)
Can be seen in the classification report, classification model Decision Tree that is made will obtain an accuracy of 0.86 or 86% if it predicts category 0 or 'not depressed' and obtains an accuracy of 0.25 or 25% if it predicts category 1 ‘depressed’, for whole classification it obtains an accuracy of 0.84 or 84%.
Accuracy Score
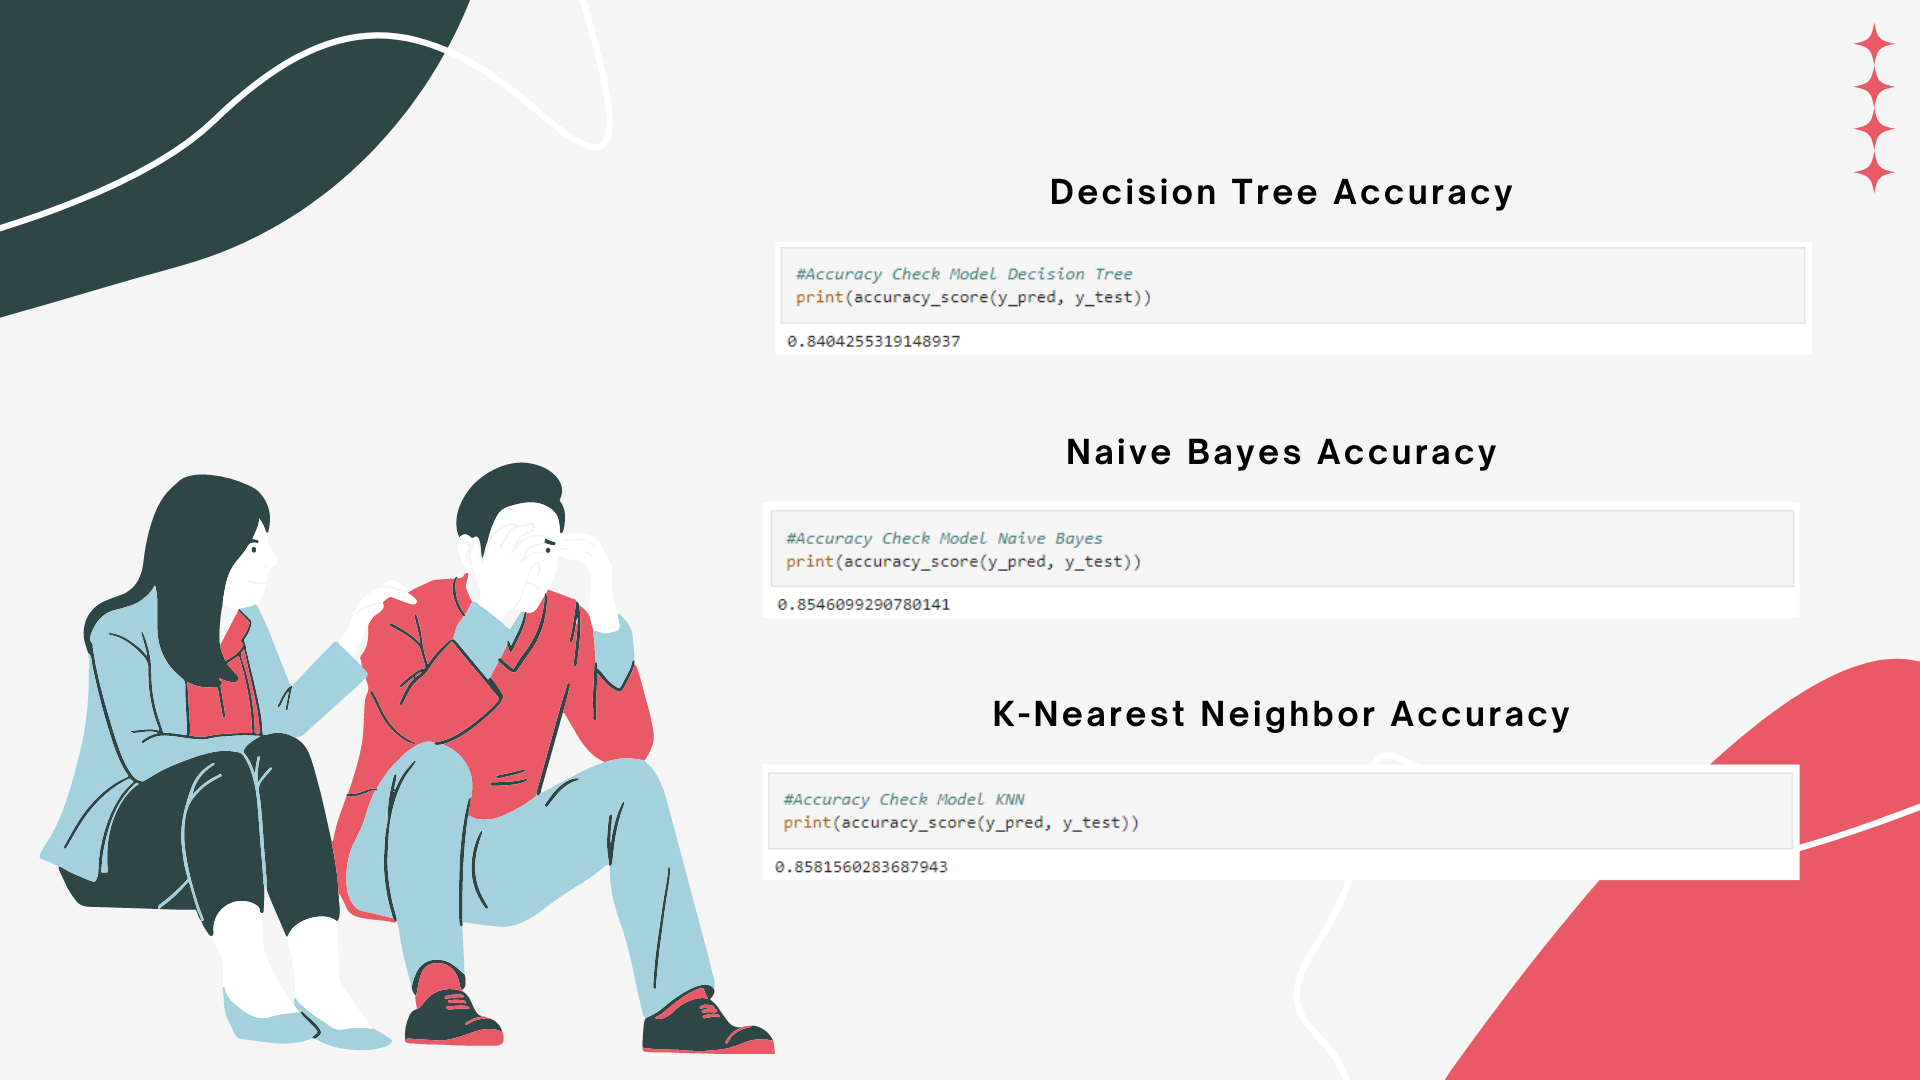
It can be seen that for the accuracy score, the accuracy obtained is 0.8404255319148937 or 84% which is considered good enough for the classification.
Naive Bayes
Here I am doing Naïve Bayes model training.
Then I tested Naïve Bayes model with x_test.
Match it with actual data.
Then I evaluation the Naive Bayes model, I use confusion matrix and classification report & accuracy score.
Confusion matrix
On that confusion matrix can be seen :
- True Positive : 2
- False Positive : 39
- False Negative : 2
- True Negative : 239
It can be concluded that the results of the confusion matrix are good because the average data enters True Negative values.
Classification Report
Can be seen in the classification report, classification model Naive Bayes that is made will obtain an accuracy of 0.86 or 86% if it predicts category 0 or 'not depressed' and obtains an accuracy of 0.50 or 50% if it predicts category 1 ‘depressed’, for whole classification it obtains an accuracy of 0.85 or 85%.
Accuracy Score
It can be seen that for the accuracy score, the accuracy obtained is 0.8546099290780141 or 85% which is considered good enough for the classification.
K-Nearest Neighbor
Before entering into the modeling process, first I determine the best K value using the elbow method.
It can be seen in the graph, after doing the elbow method it is found that the lowest error rates are at 6, 8, 9, 10, and 11. I decided to use K = 6.
Here I am doing K-Nearest Neighbor model training.
Then I tested K-Nearest Neighbor model with x_test.
Match it with actual data.
Then I evaluation the KNN model, I use confusion matrix and classification report & accuracy score.
Confusion matrix
On that confusion matrix can be seen :
- True Positive : 1
- False Positive : 40
- False Negative : 0
- True Negative : 241
It can be concluded that the results of the confusion matrix are good because the average data enters True Negative values.
Classification Report
Can be seen in the classification report, classification model KNN that is made will obtain an accuracy of 0.86 or 86% if it predicts category 0 or 'not depressed' and obtains an accuracy of 1.00 or 100% if it predicts category 1 ‘depressed’, for whole classification it obtains an accuracy of 0.86 or 86%.
Accuracy Score
It can be seen that for the accuracy score, the accuracy obtained is 0.8581560283687943 or 86% which is considered good enough for the classification.
Final Result
After doing Machine Learning Classification with comparison of Decision Tree, Naive Bayes & K-Nearest Neightbor, i can conclude :
- Decision Tree model get final accuracy of 0.8404255319148937 or 84%
- Naive Bayes model get final accuracy 0.8546099290780141 or 85%
- K-Nearest Neighbor model get final accuracy 0.8581560283687943 or 86%
All models that i have use to classification, it can be said that K-Nearest Neighbor model is best model with accuracy score 0.8581560283687943 or 86%
Github : https://github.com/Maoelan/Depression-Classification
https://www.mathsisfun.com/data/correlation.html
https://towardsdatascience.com/understanding-confusion-matrix-a9ad42dcfd62
https://muthu.co/understanding-the-classification-report-in-sklearn/
https://medium.com/swlh/confusion-matrix-and-classification-report-88105288d48f
Informasi Course Terkait
Kategori: Artificial IntelligenceCourse: Teknologi Game Kecerdasan Artifisial (SIB AI-GAME)


