
Classification Of Vertebrata.csv Using DTC
Nur Azlina


Summary
Here I use a data set from kaggle.com with the dataset name “vertebrata.csv” Each vertebrate is classified into one of 5 categories: mammals, reptiles, birds, chickens and amphibians, based on a set of explanatory attributes (predictor variables). To illustrate this point, we will first load data into a Pandas Data Frame object and display the data and produces an accuracy of 0.75 or 75% of the process
Description
Classification Of “Vertebrata.csv” Using Decision Tree Classifier
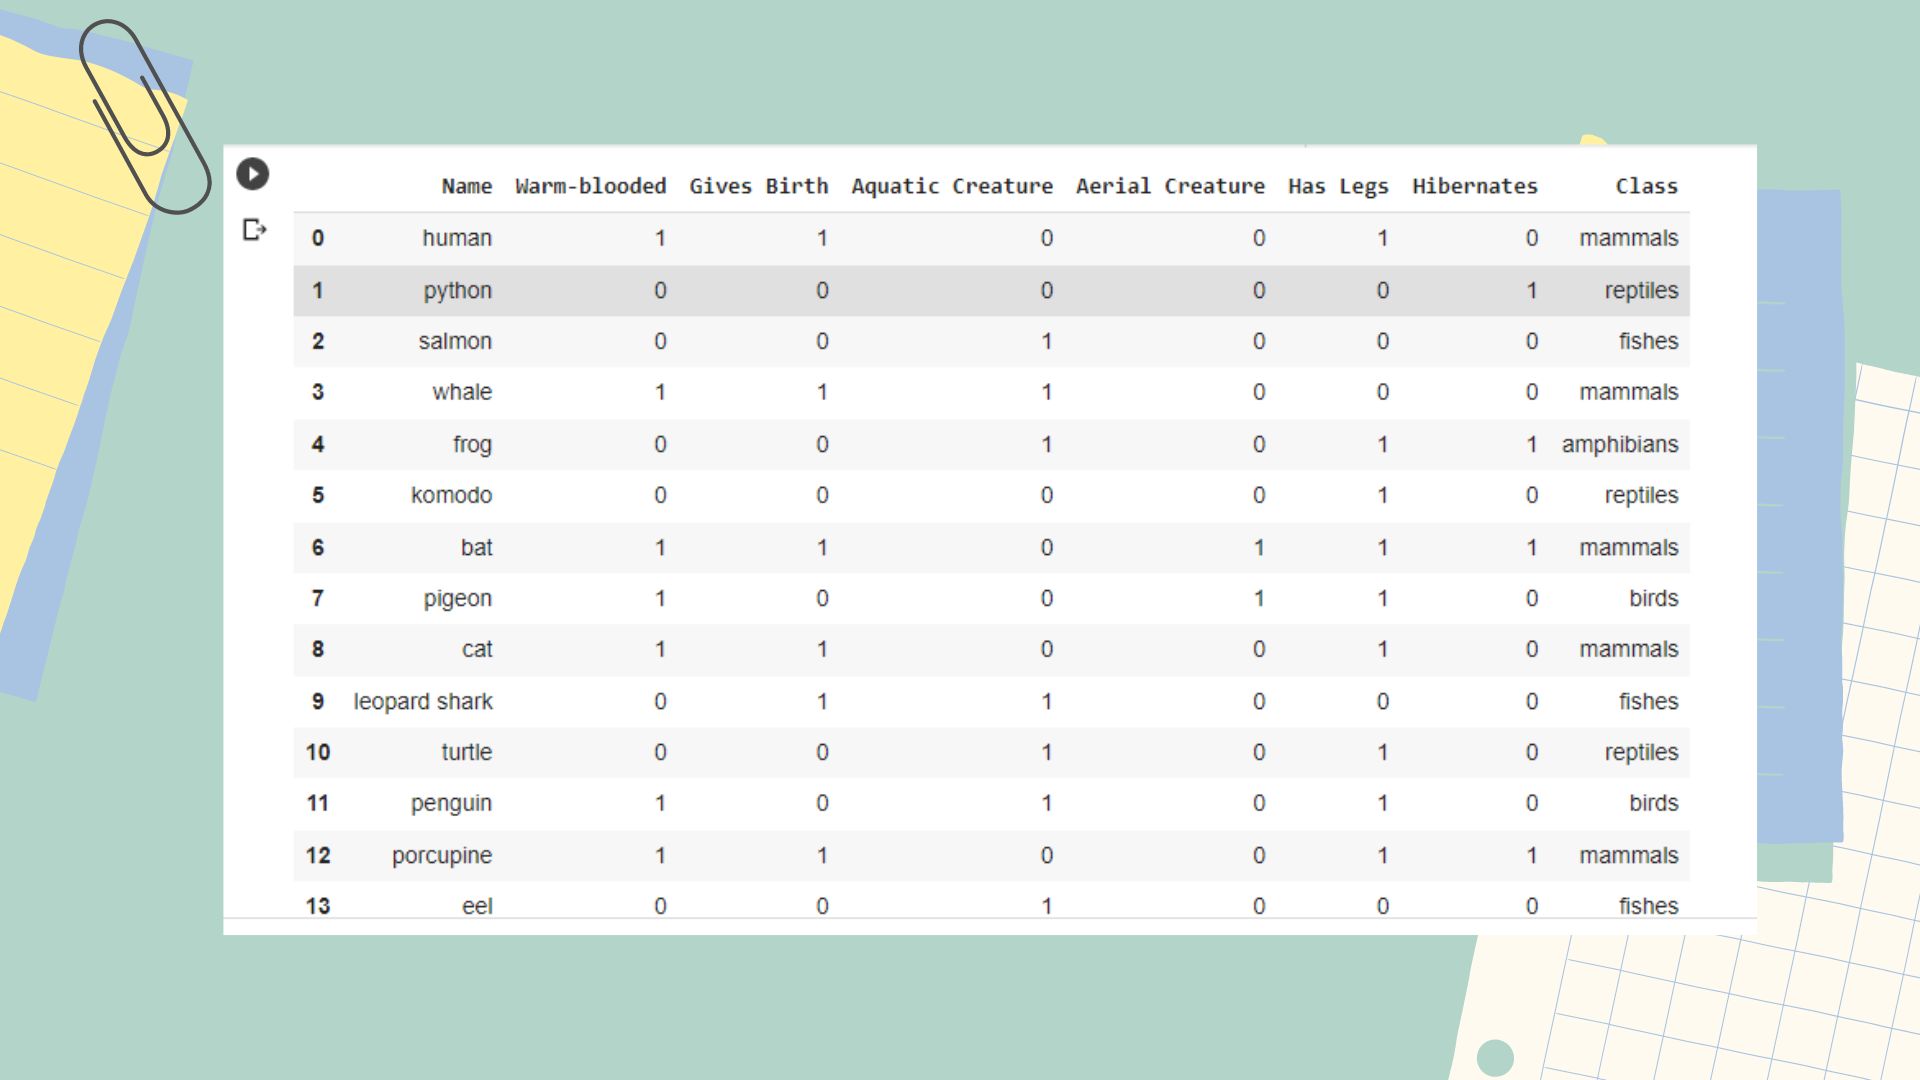
Here I use a data set from kaggle.com with the dataset name “vertebrata.csv” Each vertebrate is classified into one of 5 categories: mammals, reptiles, birds, chickens and amphibians, based on a set of explanatory attributes (predictor variables). To illustrate this point, we will first load data into a Pandas Data Frame object and display the data.

The above program is used to import the module used in the assignment, namely the pandas module which is aliased with pd. Then call the library from the Google collab and upload the vertebrate.csv data frame that was downloaded from Kaggle.

The program above is used to display the data set that has been uploaded so that the reader can know the contents of the data set.
Next, Turn the problem into a binary classification task (mammal versus non-mammal) by changing the class label of the instance to non-mammal except those belonging to the class mammal.

The program above is a program to change the column class, fishes, birds, amphibians and reptiles with non-mammals so that the data appears next where the column class, fishes, birds, amphibians and reptiles have been changed to class labels non-mammals.
We can apply Pandas cross tabulation to examine the relationship between hot-blooded and Granted attributes with respect to classes.
The program above is a program to find the relationship between the column warm-blood and gives birth so that the results above show that it is possible to distinguish mammals from non-mammals using these two attributes alone because each combination of attribute values will only produce instances that belong to the same class .
The next step is to apply a classifying tree, also known as a decision tree classifier.

Importing sklearn takes the tree method then saves the class column in Y , removes the name and class columns and then saves it in X. The classification here is limited to only producing a tree with a depth of 3.
The previous command will extract the predictor (X) and target class (Y) attributes from the vertebrate data set and create a decision tree classifier object using entropy as the impurity

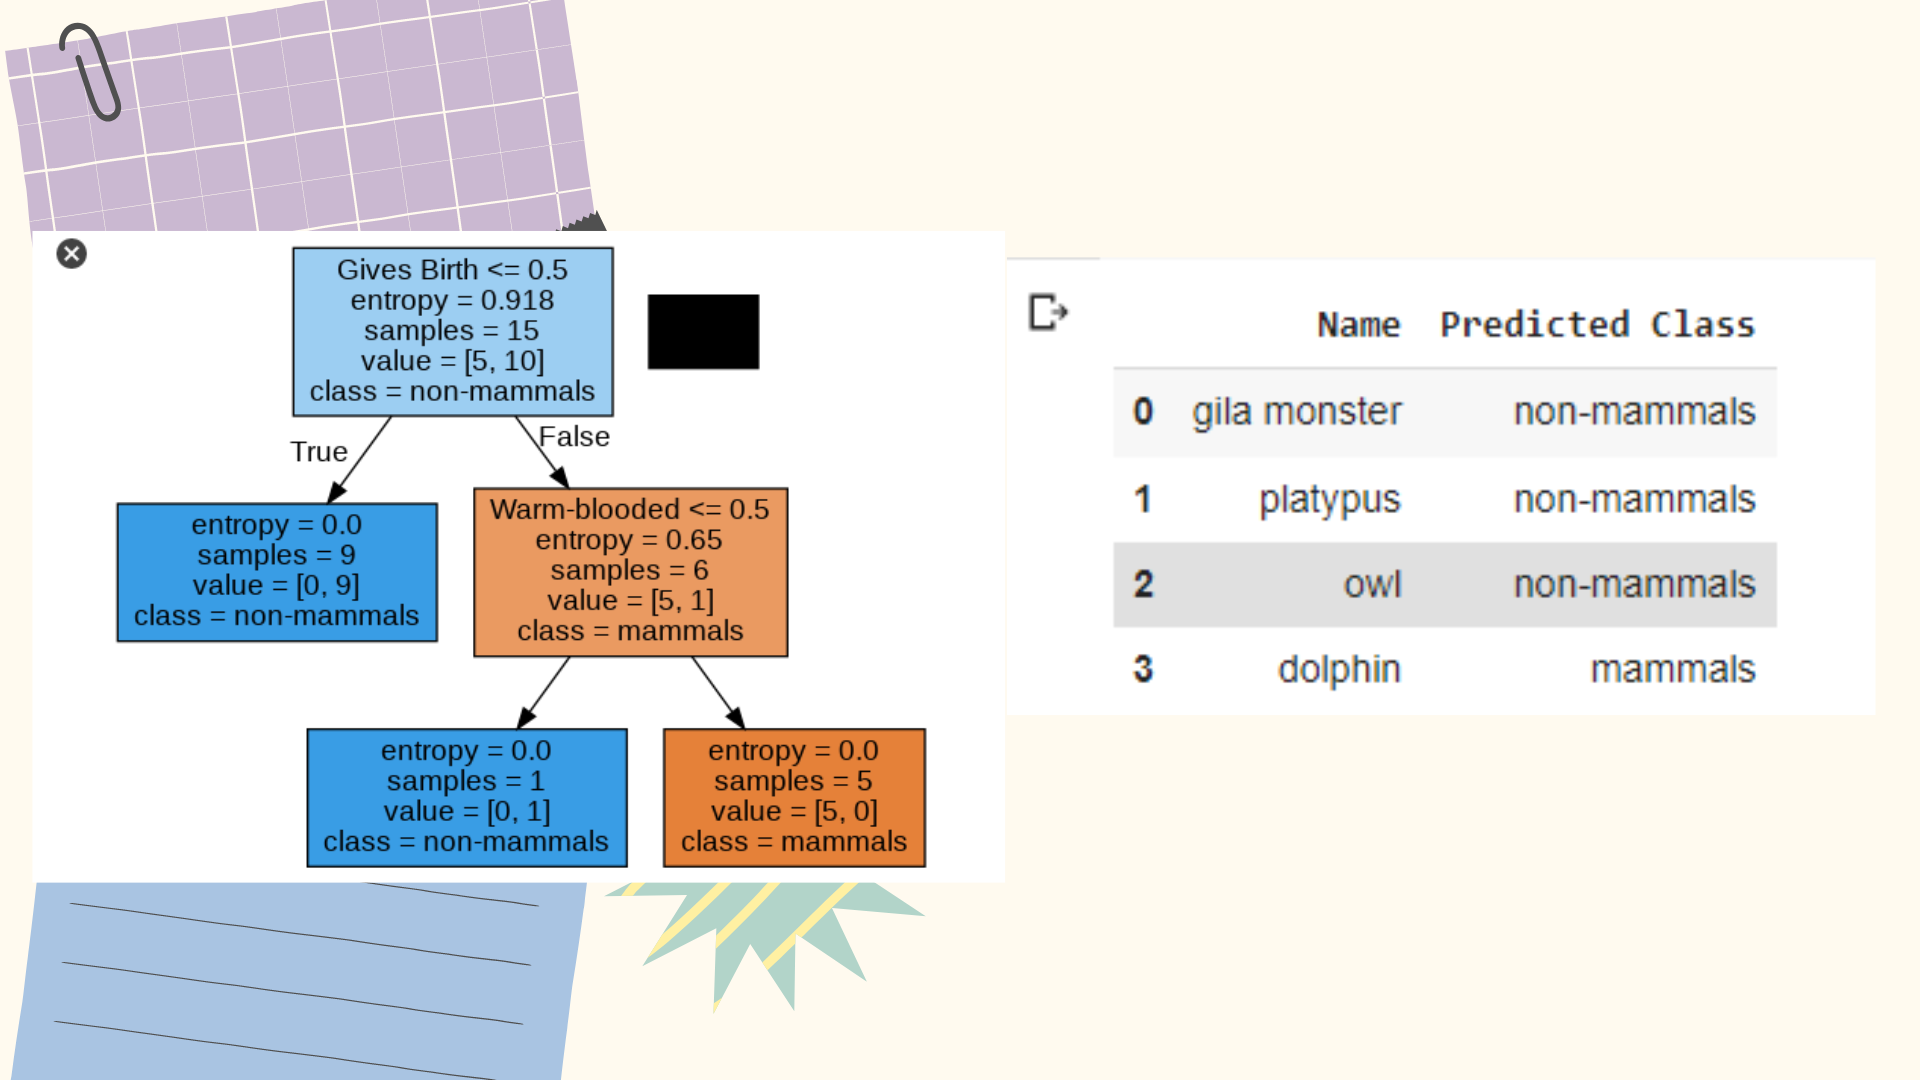
The program above is a program to display diagrams in the form of images.
So the result is as below:

Next, we apply a decision tree to classify the following test examples:

It first extracts the predictors and attributes of the target class from the test data and then applies a decision tree classifier to predict their class.

Next, we calculate the class accuracy of the data.

From these calculations, the accuracy of the data on the test data is 0.75
Conclusion :
- Class :
- Mammals
- Non-Mammals
- By Category :
- hot-blooded
- Aquatic
- Give birth to
- Air creatures
- Have legs
- Hibernation
A binary tree diagram is shown starting with the root of the first category with the right or wrong choice until the last category, in this case warm-blooded creatures and creatures that give birth are combined into one category, then after becoming a tree, testing of data sets and accuracy is performed .and produces a good accuracy value of 0.75 or 75%
Informasi Course Terkait
Kategori: Artificial IntelligenceCourse: Teknologi Kecerdasan Artifisial (SIB AI-Hacker)


