
EDA For Medical Insurance Cost Prediction
Eka Wulan Yunita


Summary
Exploratory Data Analysis or EDA is first investigative test process that aims to identify patterns, find anomalies, test hypotheses and check assumptions. EDA is an important process in data analysis because of EDA, users will be able to save more time in the data analysis process, be able to find out some errors in the data such as missing values, outliers, duplications, encodings, noisy data, incomplete data, and etc. The data that will be predicted is taken from kaggle.com which contains BMI, Price, Gender/Sex, Smkoker, and Age that will be analyzed. The steps is taken in this case study are Load the data, Preprocessing Data, Data Visualization, and Correlation.
Description
What is EDA ?
Exploratory Data Analysis or EDA is first investigative test process that aims to identify patterns, find anomalies, test hypotheses and check assumptions. In EDA, users will be greatly assisted in detecting errors from the start, being able to identify outliers, knowing the relationships between data and being able to explore important factors from the data. The EDA process is very useful in the process of statistical analysis. Thus, it is not surprising that professional data practitioners have used EDA very often so that the analysis results become more valid and relevant to business goals. In general, there are several exploratory data analysis techniques, namely by using descriptive statistics, univariate analysis, and multivariate analysis. EDA is an important process in data analysis because of EDA, users will be able to save more time in the data analysis process, be able to find out some errors in the data such as missing values, outliers, duplications, encodings, noisy data, incomplete data, and etc.
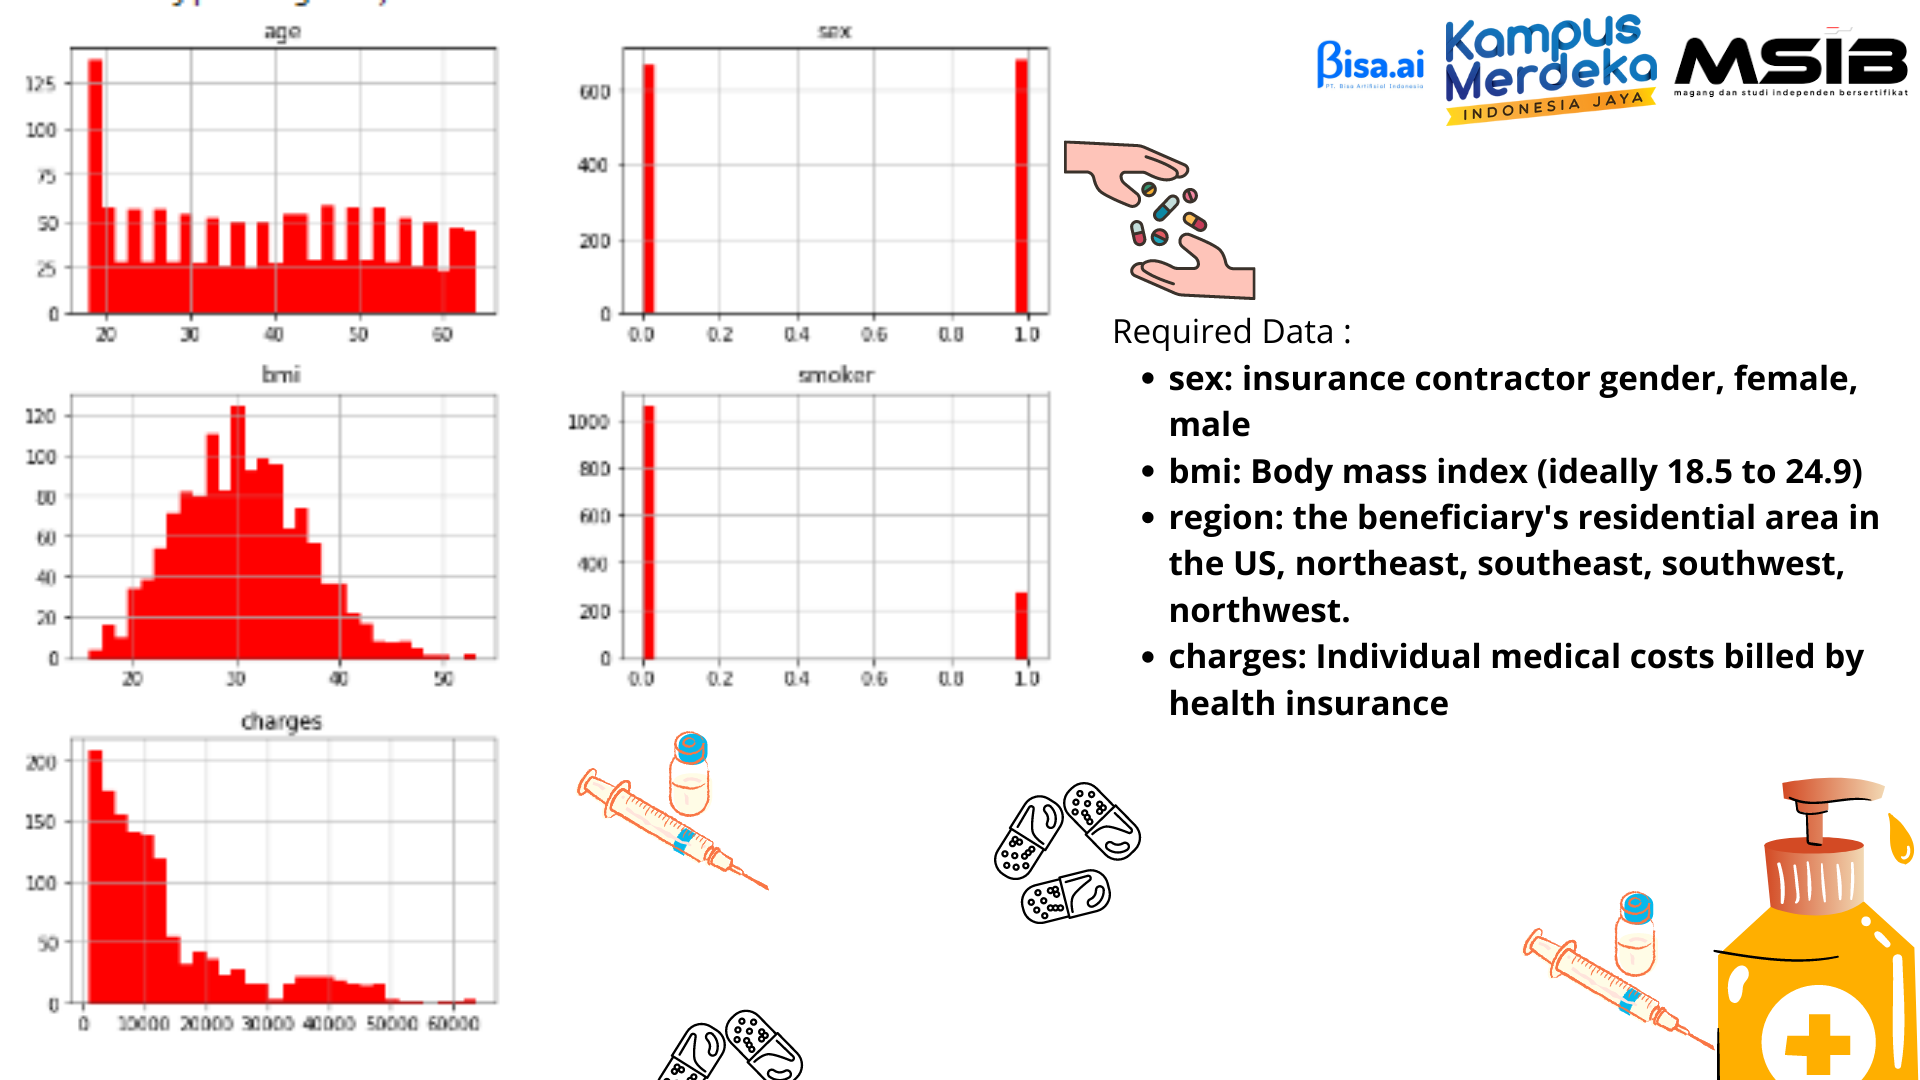
This is EDA for predicting Medical insurance prices, which the dataset is obtained from kaggle.com. This dataset contains several data, namely:
- Sex : insurance contractor gender, female, male
- BMI : Body mass index (ideally 18.5 to 24.9)
- Smoker: smoking habits
- Region: the beneficiary's residential area in the US, northeast, southeast, southwest, northwest.
- Charges: Individual medical costs billed by health insurance
This process goes through several steps, namely: Data Load, Data Preprocessing, Data Visualization, and Correlation.
Steps :
1) Load Data
- Import Library

Import all required libraries. There are several libraries that are used, namely:
1. pandas, used to import data, etc.
2. numpy, used to process data
3. Seaborn, used for graphics and statistics.
4. matplotlib, used for data visualization such as plotting graphs.
- Load the Data
The data is taken from kaggle.com. Then, the data is uploaded on google colaboratory. then, called by pd.read_csv("")

- Data Shape
This is used to determine the size of the array

- Data Describe

The describe() function is used to display descriptive statistics from a data frame or series. The output of this function contains a summary of the central tendency and distribution of the dataset. The function of describe() helps us to get an overview of the dataset. The function of Transpose returns a vertical range of cells as a horizontal range, or vice versa.
2) Data Preprocessing
- The Unique data
Elements in the region are divided into several columns consisting of each country. This aims to make predictive data more valid.


- Converting into numbers
Because of machines can only understand numbers, so all data will be converted into numbers, such as: Sex/gender, smoker, and children

.
- Removing
In this insurance cost prediction, children's data is not needed, so we must delete it.

- Cheking the data
The IsNull() function is used to check whether a column has data or not. and if there is no data or NULL, then given the replacement data.


- Grouping data
The GroupBy() function allows us to group data in the same set of items for example in location, product, education level, gender, and other categories. here, it is used to get the total score or average grade by age.

3) Data Visualization
- Exploratory Data Analysis using visualisasi

RESULT :

- Using Pair plot

RESULT :

- Bivariate analysis


4) Correlation Matrix
The correlation matrix is a matrix that shows the simple correlation between all possible pairs of variables involved in the analysis. Value or all possible pairs of variables involved in the analysis.

Informasi Course Terkait
Kategori: Data Science / Big DataCourse: Infrastuktur Kecerdasan Artifisial (SIB AI-INFRA)


