
Classification of Wood Defect Using CNN and K-Fold
RAHMAT AMIN BADALI

Summary
Introduction
Until now, wood is a building material that cannot be replaced in construction. This is because wood is a basic material for producing various types of products. Inspection of wood in the wood processing industry is currently still carried out manually with human assistance, this seems to be subjective because everyone's assessment is different and time consuming. In addition, the accuracy of the inspection still varies due to factors such as fatigue and human error due to repetitive work. For that we need a system that can work automatically in classifying and detecting defects in wood. One solution is to use Artificial Intelligence-based technology.
The purpose of this system is to design a wood defect detection system using color image as input and the CNN algorithm to detect and classify wood defects. The advantage of the CNN method is that it can automatically extract important features (features) from each image and combine them with classification, besides that the CNN method is also known to have a high degree of accuracy in classification. Then the model will be validated using K-Fold Cross Validation to evaluate the performance of the model. Detecting wood defects will certainly be useful in sorting wood to reduce human error and the sorting stage will be more effective.
Description
Method

Fig. 1. Architecture of a wood defect classification and detection system
A. Data Acquisition
The dataset used in this experiment was taken from Kaggle.com in the form of images that have been resized from images from the original source. The original source of this dataset was provided by (Kodytek P, Bodzas A, and Bilik P, 2022) in his journal entitled "A large-scale image dataset of wood surface defects for automated vision-based quality control processes". The dataset contains 43,000 images of wood defects which are divided into 10 classes of wood defects, but in this experiment only 8 classes of wood defects were used. The image was taken using a camera from above with a distance of 40 cm from the object and 15 cm from the object where there is a light source.
From the dataset used, 900 images were taken which were divided into 800 images for training data and 100 images for testing data. The data is also divided again for each class.
Class | Amount | Training | Testing |
| Crack | 120 | 100 | 20 |
| Dead knot | 120 | 100 | 20 |
| Knot missing | 110 | 100 | 10 |
| Know with crack | 110 | 100 | 10 |
| Live knot | 110 | 100 | 10 |
| Quartzity | 110 | 100 | 10 |
| Marrow | 110 | 100 | 10 |
| Resin | 110 | 100 | 10 |

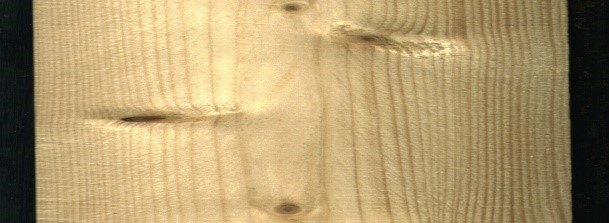
Fig. 2. An example of a defective image of the wood used
B. Data Preprocessing
The image was preprocessed by changing its size to 150 x 150. Previously, cropping was also carried out for each wood defect in the image from the dataset so that it could be differentiated per class. Because this experiment uses PyTorch, the data is converted into a tensor form. Then the image is normalized to remove some of the noise caused by light or shadows.
Import the required libraries

Load the dataset and differentiate it into data for training and testing, because it uses PyTorch, it transforms and converts data from numpy to tensor, then normalizes it.

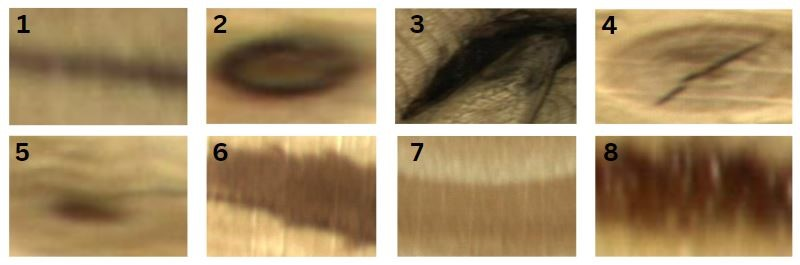
The following are 8 types of wood defect classes that will be classified:

Fig. 3. Image of various classes (1) Crack, (2) Dead knot, (3) Knot Missing, (4) Know with crack (5) Live Knot, (6) Marrow, (7) Quartzity, and (8) Resin
C. Training
Training is the stage where the model will learn the inputs given to be used in the classification and detection of defects in wood.
The architecture of the CNN model in this experiment uses 3 convolutional layers to classify images into eight categories. Then also added 2 drop out layers to limit the risk of overfitting. The input image size is 256 batch size, with 3 channels, and 150 x 150 image size.

After the model is formed, the adam optimizer is used with a learning rate of 0.0001 and a cross entropy loss function.

Now the model can be applied using K fold Cross Validation. The number of Folds used in this training process is k = 10 and in each of these folds there are 10 epochs.


Fig. 4. Accuracy training graph.
In the graph above it can be seen that the average value of accuracy has increased for each fold. With the highest average accuracy found in the 10th fold, which is 99.9%.
D. Testing
For the results of testing carried out using the same CNN model as the training results. In the testing process, K fold cross validation was also re-applied with a total of 10 K. The number of images used during this testing process was 100 images of wood defects. By using the number of epochs of 10 for each fold, the best accuracy is obtained at the 10th fold with an average accuracy value of 99.5%.

Fig. 9. Accuracy testing graph

Result
The test results using the K-Fold Cross Validation on the 10th fold get the highest average training accuracy with an accuracy value of 99.9 percent. Whereas for testing the highest accuracy is in the 10th fold with an accuracy of 99.5 percent. While the smallest average training accuracy value is obtained from Fold 1 with an accuracy value of 79.2 percent. The lowest average value for testing accuracy is obtained at fold 1 with a value of 64.64 percent. The system accuracy obtained from the K-Fold Cross Validation method is 95.63 percent for training accuracy and 92.79 percent for testing accuracy which is obtained from the average results of all Fold accuracy in each trial. Fold 10, as the fold that has the highest average accuracy value is used as training data in the next scenario experiment.

| Fold | Average Training Accuracy (%) | Average Testing Accuracy (%) |
| 1 | 79.2 | 64.64 |
| 2 | 92.9 | 87.2 |
| 3 | 94.6 | 93.1 |
| 4 | 97.2 | 94.7 |
| 5 | 96.7 | 95.6 |
| 6 | 97.8 | 98.1 |
| 7 | 98.2 | 96.7 |
| 8 | 98.1 | 87 |
| 9 | 97.7 | 97.1 |
| 10 | 99.9 | 99.5 |
| Average | 95.14 | 91.36 |
Tabel 2. Test Result

Fig. 6. Comparison graphic of Accuracy Training and testing
Informasi Course Terkait
Kategori: Artificial IntelligenceCourse: Riset Kecerdasan Artifisial (SIB AI-RESEARCH)