Stroke Prediction
Anisa Nur Syafia
Summary
A stroke is a serious life-threatening medical condition that happens when the blood supply to part of the brain is cut off.Strokes are a medical emergency and urgent treatment is essential. The sooner a person receives treatment for a stroke, the less damage is likely to happen. In this portfolio, I will discuss how to classify stroke predictions use KNN, Decision Tree and Random Forest.
Description
Before starting, I will explain the 3 classification models that I use:
KNN = The k-nearest neighbors algorithm, also known as KNN or k-NN, is a non-parametric, supervised learning classifier, which uses proximity to make classifications or predictions about the grouping of an individual data point. While it can be used for either regression or classification problems, it is typically used as a classification algorithm, working off the assumption that similar points can be found near one another.
Decision Tree = A decision tree is a decision support tool that uses a tree-like model of decisions and their possible consequences, including chance event outcomes, resource costs, and utility. It is one way to display an algorithm that only contains conditional control statements. Decision trees are commonly used in operations research, specifically in decision analysis, to help identify a strategy most likely to reach a goal, but are also a popular tool in machine learning.
Random Forest = Random forest classifier is a classification method consisting of a collection of decision trees supported by training data and independent random features with different features. Random forest is an algorithm that is able to classify large amounts of data accurately and the end result is obtained from determining the root node and ending with several leaf nodes.
Now, let's start from the initial stage:
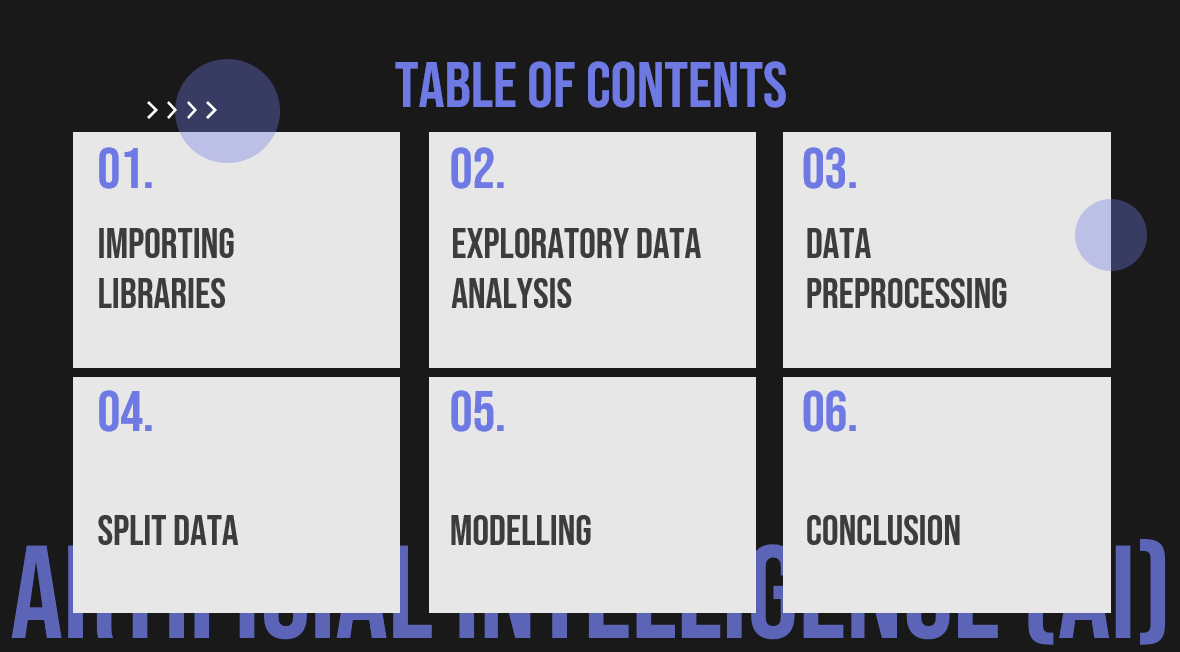
Importing the libraries
Loading or read the datasets
Exoloratory Data Analysis
there are some statistical information about the dataset.
data correlation.
Data preprocessing
Handling missing value.
Filling the missing.
Handling the outliers.
Note : the gender column as was mentioned before has 3 categories: Female, Male, Other. By looking at the other category we will find that has only one record, so we can drop this record.
Encoding
Gender column encoding.
Scaling
As notice the range of columns like bmi,avg_glucose_level and age differes from the range of columns like Residence_type, work_type, etc.. So to avoid that one feature being demonstrated by the others, we need to do feature scaling to make all the features almost have the same range.
Feature selection
From the correlation table, we can just keep the features which are highly correlated to each other. We are going to keep age, hypertension, heart_disease, avg_glucose_level and bmi.
Balanced the data
Split Data
Modelling
KNN
Decision Tree
Random Forest
Conclusion
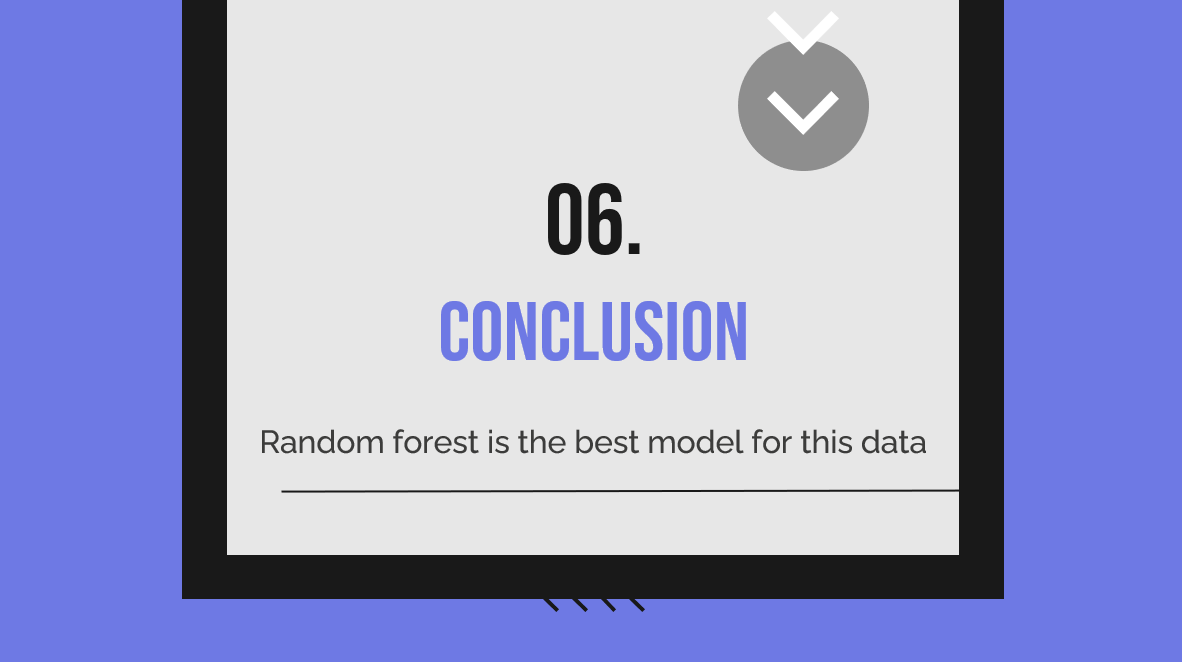
Random forest is the best model for this data
Informasi Course Terkait
Kategori: Artificial IntelligenceCourse: Riset Kecerdasan Artifisial (SIB AI-RESEARCH)


