
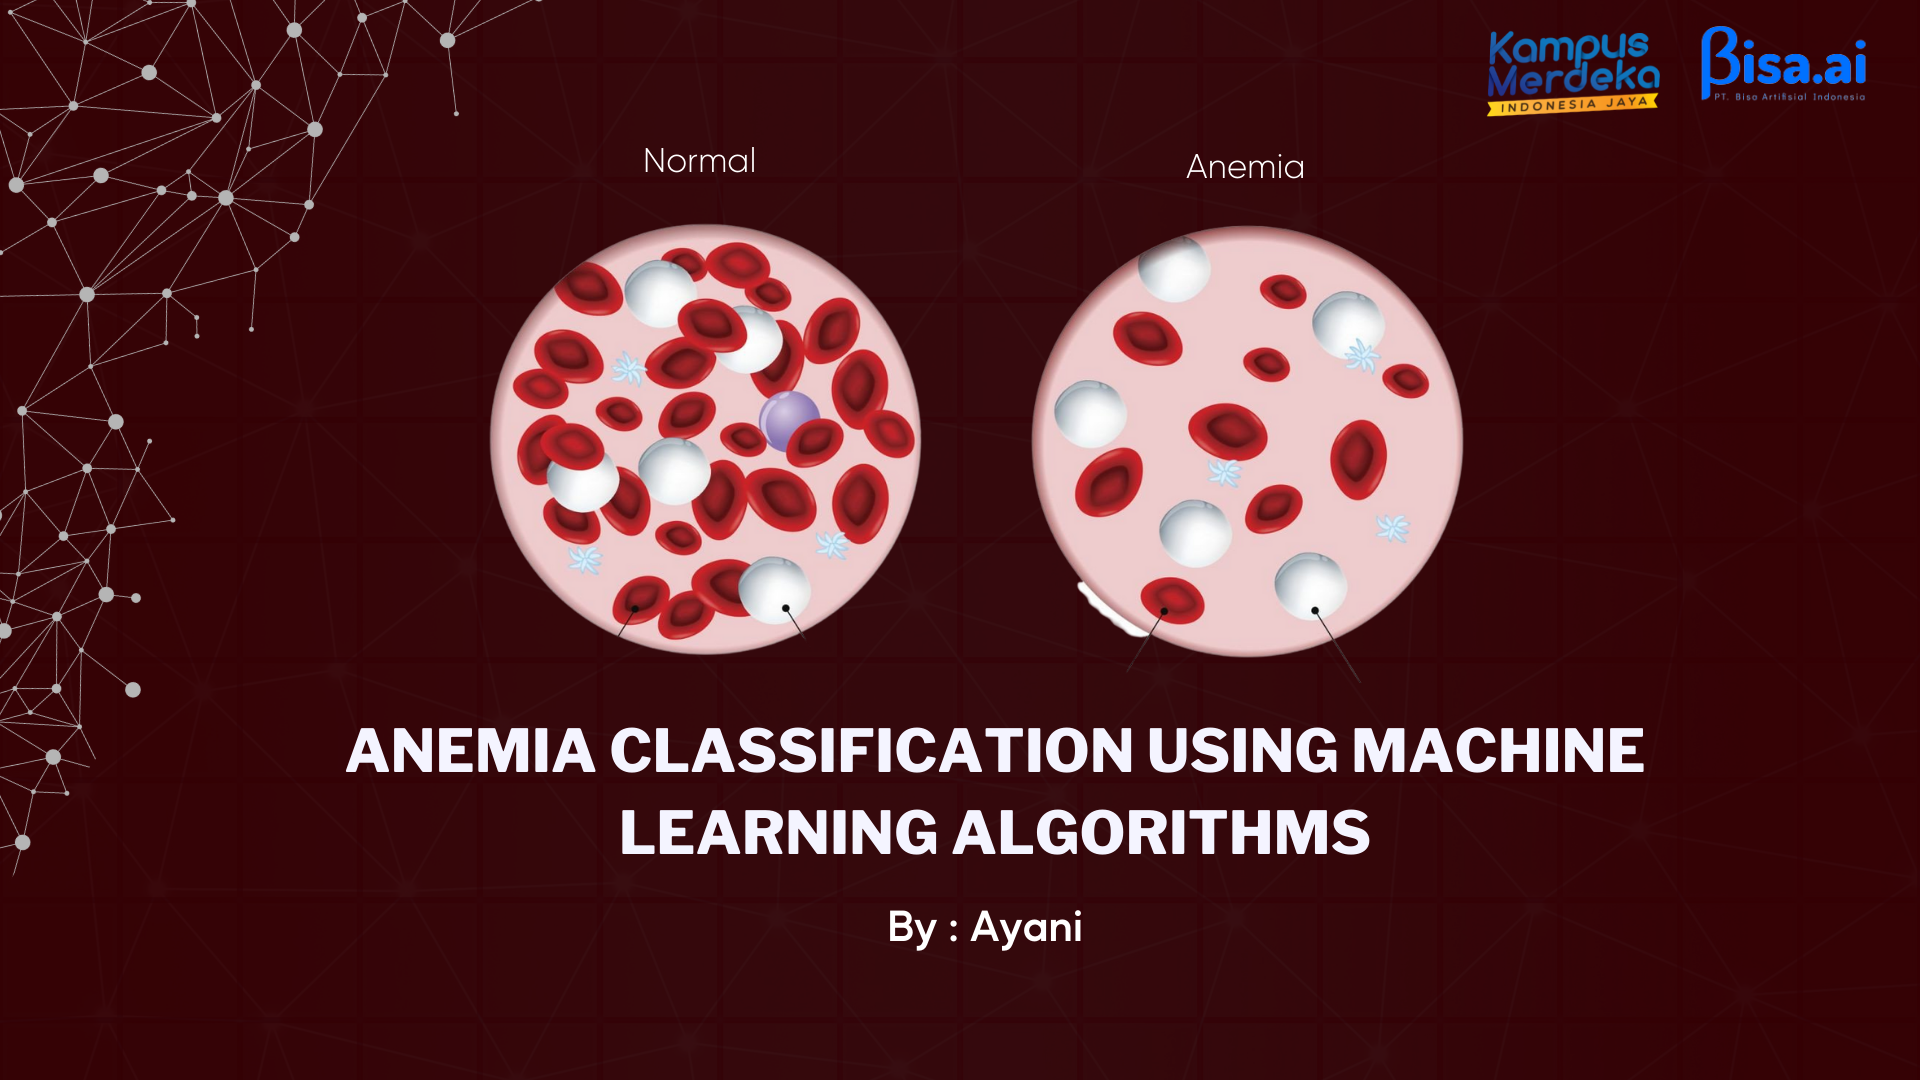
Anemia Classification using Machine Learning
Ayani

Summary
Anemia is when the body experiences a blood disorder characterized by a low number of red blood cells in the human body. Anemia, or what can be called a lack of blood, can occur when red blood cells do not contain enough hemoglobin so that the body cannot function normally. From this, it is necessary to have an anemia classification system in the health sector to predict the possibility of patients suffering from anemia. This portfolio will discuss programs for classifying anemia using the application of Machine Learning algorithms, namely Support Vector Machine (SVM), K-Nearest Neighbor (KNN), Decision Tree, Logistic Regression, Naïve Bayes, and Random Forest.
Description
Machine Learning is an area of Artificial Intelligence that deals with developing commonly programmed techniques and learning from past data. In general, machine learning is divided into 3 parts : Supervised Learning, Unsupervised Learning, and Reinforcement Learning.
SVM, KNN, Decision Tree, Logistic Regression, Naïve Bayes, and Random Forest are machine learning algorithms that belong to the supervised learning type and can be used to solve classification and regression problems.
The following is an example of a program to classify Anemia using a Machine Learning algorithm.
Ekplaratory Data Analysis (EDA)
Importing the necessary libraries

Read Dataset and save it into dataframe
The anemia dataset contains the attributes Gender, Hemoglobin, MCH, MCHC, MCV and Result. This dataset predicts the likelihood of a patient suffering from anemia. It consists of 1421 records/rows and 6 columns as attributes.

To display a description of the dataset that can help us get an overview of the dataset.

Data Cleaning
Data cleaning is preparing and correcting incorrect, incomplete, duplicative or inaccurate data by deleting and modifying the data. This time we will check duplicate data and missing data.
there are 887 duplicate data so from that we have to delete the data.

Correlation can be used to determine the closeness of the relationship between several variables. From the picture, it can be concluded that the darker the color, the stronger the correlation.

Cheking Outlier
An outlier is an observation condition of data with unique characteristics that look very different from other data. After checking, it turned out that there were no outliers from the anemia dataset

Normalization min max. Minmax is a normalization method by performing a linear transformation on the original data.
So the maximum value is 1, and the minimum value is 0

Crosstab is used to see the relationship between two variables in one table.

Data Visualization
From this dataset, we can see the number of people suffering from anemia which will give an idea of whether the data is balanced or unbalanced.
Result: 0- not anemia, 1-anemia

Category Features based on gender, it can be seen that women's language suffers more from anemia than men.
Gender: 0 - male, 1 – female

Summary of Distribution of features over the dataset

Training and Testing models
Splitting of dataset into Train and Test

Predictive Modelling


Model Evaluation
Classification Report


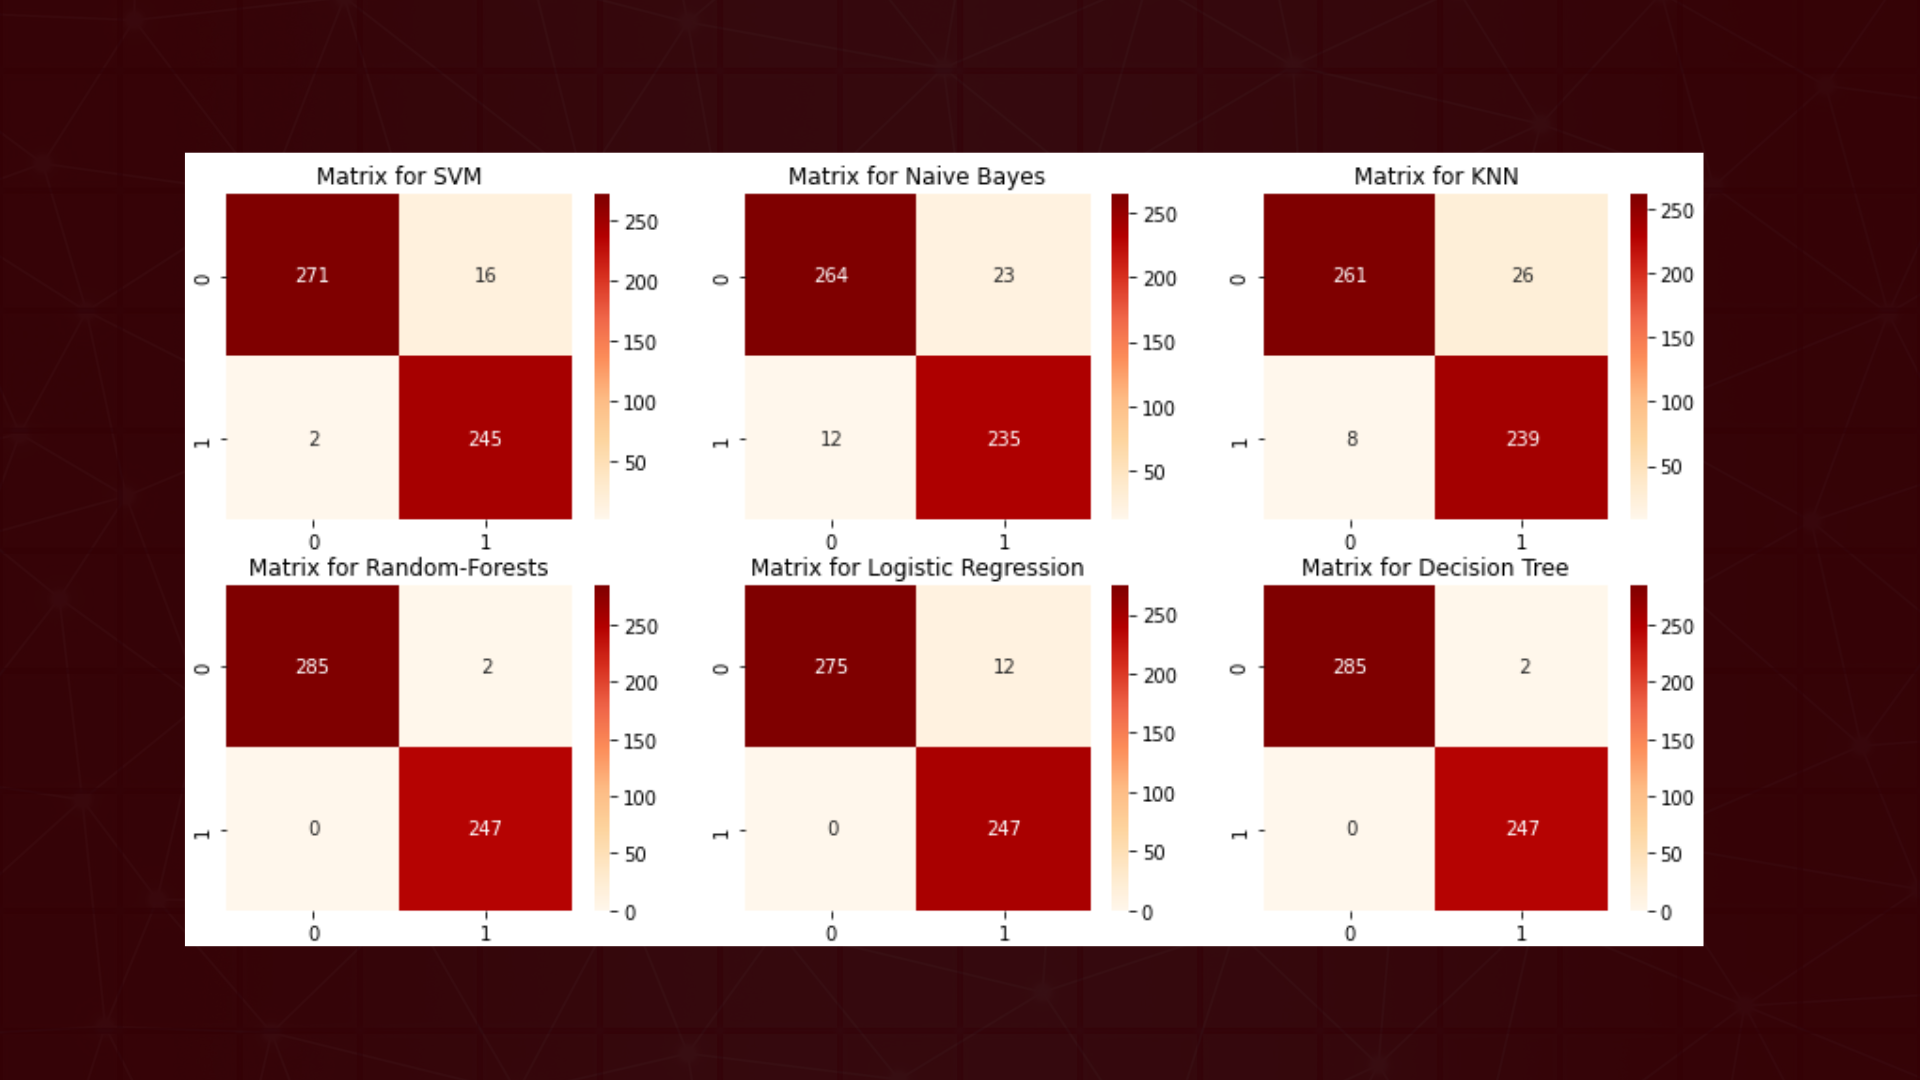
Confusion Matrix


Summary
The highest accuracy results are obtained from the Decision Tree algorithm with an accuracy of 100%. The exploratory analysis of the data shows that people with anemia have a significant influence, namely low hemoglobin, and the female sex predominates for anemia. To get more accurate analysis results, you can add more variables that explain hemoglobin and individual age.
Informasi Course Terkait
Kategori: Artificial IntelligenceCourse: Riset Kecerdasan Artifisial (SIB AI-RESEARCH)


