
EDA of Google Play Store Top Games
Ghalbin Al Ghafiqi


Summary
In this experiment I will create a model to analyze the Top 5 Ranked Games by Category. The analysis aims to obtain DSBIZ certification by creating an EDA from a data set taken from kaggle.com which contains a data set of the top 100 games from each game category on the Google Play Store along with their ratings and other data such as price and number of installs.
Description
Before doing Exploratory Data Analysis, first download the dataset (https://bit.ly/TopGamesOnGooglePlayStore). This is a dataset of top 100 games of each category of games on Google Play Store along with their ratings and other data like price and number of installs.
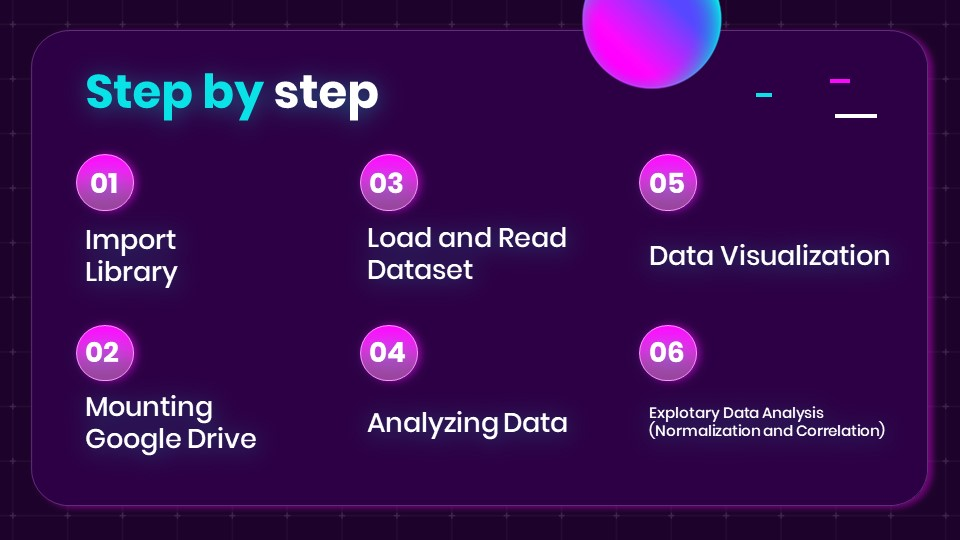
Here are some steps for Exploratory Data Analysis using Google Colab:
First, Let's begin with importing the necessary libraries

The libraries used to explore data with python are pandas, matplotlib, seaborn and numpy. Pandas and numpy make it easier to process numeric data and analyze data, while matplotlib and seaborn work to create visualizations.
Second, mount Google Drive first so that the dataset can be accessed.

Third, it's time to load and read through the dataset to get an overview


The head() method returns a specified number of rows, string from the top.

The tail() method returns a specified number of last rows.

I usually use df.head(n) and df.tail(n) to validate that the dataset loaded and looks like how it should be.

df.columns returns the label of each column in the DataFrame

The dataset consists of 1730 rows and 15 columns, where the variable names for the 15 columns can be found using the df.columns function while the index on the data is in the range 0 to 1730 with increments or step = 1. Based on the data above the columns' total ratings ' is the dependent variable while the rest are independent variables.
fourth, before analyzing the data, first check the missing values contained in the dataset.

The number of missing values in each variable is 0 or there are no missing values in each column. What needs to be considered is isna() is used to detect missing values in the data, if the data has a value of 0 then it will not be detected as a missing value, because the missing value is not equals 0.
Now we can display all columns and their data types

df.info() returns information about the DataFrame.
The information contains the number of columns, column labels, column data types, memory usage, range index, and the number of cells in each column (non-null values)
We can easily see from df.info()
- There 15 columns
- 1730 entries (rows)
- No missing values
- 8 int64, 3 float64, 3 object and 1 bool type column in the dataframe
- There seems to be 11 numeric columns
- We may make some calculations with numeric columns
fifth, data visualization. Necessary Adjustments Before Analysis Let's go on further with 'install' column 'installs' column displays numeric values. However, it's type is 'object'. We have to fix it.

Via the 'in_thousand' function we will change the values into million

we see the data install has changed to a value of millions

Next, we check again that the install data type has changed to an int data type and is worth millions

Next are the 'paid' and 'price' columns
- 'price' and 'price' columns are seemed to be common. If we have look at the values of these columns we can easily observe that almost all the games are free. We can drop one of them.

Sixth, dataset normalization on 'price' data

Almost all games are free. Only 7 games are paid. Whether the games are paid or not does not seem to be a distinguishing feature for EDA, as it can be seen. I'm dropping the 'price' column as I think only the 'paid' column will be enough for further analysis.

Then check the number of columns and rows when the 'price' data has been dropped

It can be seen that the number of columns has disappeared by one.

As seen above;
A new float64 type column was created from the 'installs' column by feature engineering
The 'price' column has been dropped for simplicity since the 'paid' and 'price' columns have similar content
Now we have 1730 rows (Games) and 14 columns (Feature)
Seventh, Exploratory Data Analysis
To view summary information about the columns, i am going to use a user defined functions seen below


- Most of the ratings are in the range of 0-500.000
- The mean is greater than the median
- We have highly right skewed distribution because of outliers on the maximum side of the distribution
- Because of outliers, it would be a good idea to look for the median based approach since median is more resilient to outliers than mean

- This time the outliers on the minimum side
- The mean and median values are almost equal
- Most of the values are 4
- We have 158 outliers


Almost all categories have the same size.
Next displays the analysis results of the Top 5 Ranked Games by Category

The eighth stage, the correlation process on the data


From the heatmap above, the brighter the color on the box, the higher the correlation value between the 2 variables.

The variable that has the highest correlation is the total ratings variable with a 5 star ratings, this means that as the year (total ratings) increases, the 5 star ratings value will also increase. To prove this, you can use a scatter plot to see the relationship between the variables of the total ratings and the 5 star ratings.


Conclusion
- I did this analysis aiming to get DSBIZ certification by creating an EDA from a dataset taken from kaggle.com.
- First of all I understand in advance what is EDA,
- and then trying to understand our data set to get the data analysis results,
- After getting an overview and understanding the variables, proceed to get the basic information from the data frame,
- Although there are no missing values and duplicate values in the data set, I'm leaving them here as a reminder because I believe cleaning the data set is the most important stage of EDA work,
- According to the results of the basic information from the data set, I performed different operations and made some necessary adjustments to some of the columns,
- And finally visualizing variables to analyze the relationship between variables.
Informasi Course Terkait
Kategori: Artificial IntelligenceCourse: Teknologi Game Kecerdasan Artifisial (SIB AI-GAME)
