
EXAMPLE OF MACHINE LEARNING CASE STUDY
Nida Maulida

Summary
This portfolio contains examples of case studies using machine learning, comparisons of the models used include Support Vector Regression, Decision Tree Regression, and Random Forest Regression.
Description
- Introduction
A. SVR (Support Vector Regression)
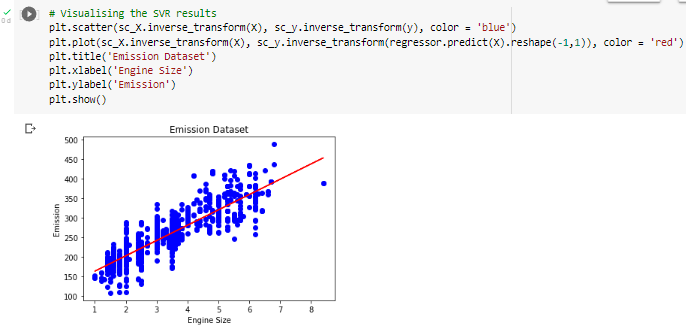
SVR provides the flexibility to determine how much error is acceptable in the model and will find the appropriate line (or hyperplane in higher dimensions) to fit the data. In contrast to the usual Least Square, the objective function of the SVR is to minimize the coefficients — more specifically, the l2-norm coefficient vector — not the squared error.
B. DTR (Decision Tree Regression)
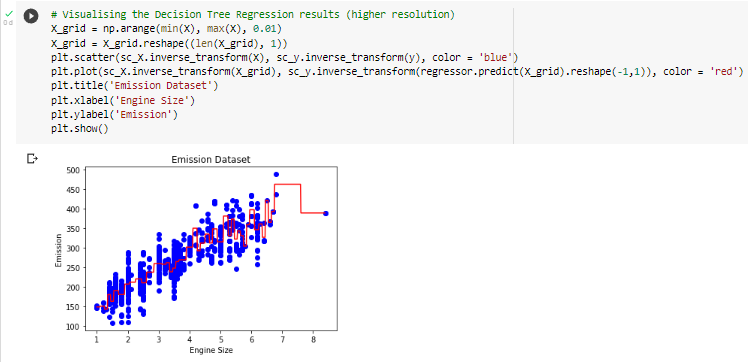
Decision Tree Regression (DTR) builds a regression model in the form of a tree structure. DTR breaks down the dataset into smaller and smaller subsets while at the same time the associated decision tree is developed incrementally. The end result is a tree with decision nodes and leaf nodes. With a given data point, the DTR is run completely through the entire tree by answering True/False questions until it reaches a leaf node. The final prediction is the average of the values of the dependent variable in a given leaf node. Through several iterations, the Tree is able to predict the exact value for the data point.
C. RFR (Random Forest Regression)
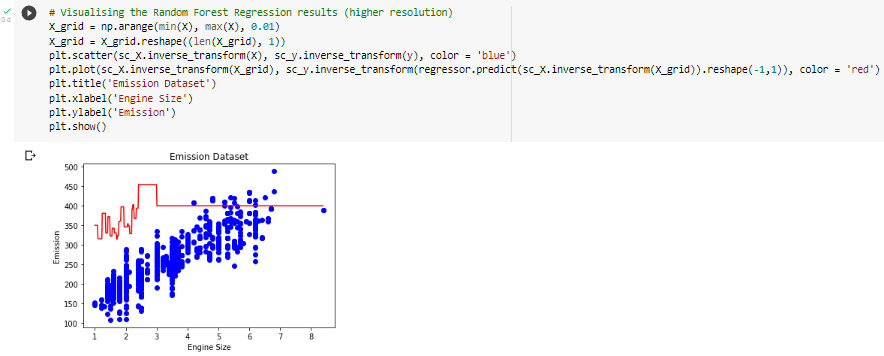
A Decision Tree is an algorithm that is easy to understand and interpret and therefore one tree may not be enough for the model to learn its features. On the other hand, Random Forest is also a “Tree” based algorithm that uses the quality features of multiple Decision Trees to make decisions. Therefore, it can be referred to as 'Forest' or 'Forest' of trees and hence called “Random Forest”. The term 'Random' or 'Random' is due to the fact that this algorithm is a forest of 'Decision Trees'. made at random'. The Decision Tree Algorithm has the main disadvantage of causing over-fitting. This problem can be overcome by applying Random Forest Regression (Random Forest Regression) as a substitute for DTR. In addition, the Random Forest algorithm is also very fast and powerful compared to other models. other regressions.
2. Dataset
The downloaded FuelConsumptionCo2.csv dataset contains specific models for fuel consumption ratings and estimates of carbon dioxide emissions for light vehicles sold in Canada.
Dataset Link (https://open.canada.ca/data/en/dataset/98f1a129-f628-4ce4-b24d-6f16bf24dd64)
- MODELYEAR e.g. 2014
- MAKE e.g. Acura
- MODEL e.g. ILX
- VEHICLE CLASS e.g. SUV
- ENGINE SIZE e.g. 4.7
- CYLINDERS e.g 6
- TRANSMISSION e.g. A6
- FUEL CONSUMPTION in CITY(L/100 km) e.g. 9.9
- FUEL CONSUMPTION in HWY (L/100 km) e.g. 8.9
- FUEL CONSUMPTION COMB (L/100 km) e.g. 9.2
- CO2 EMISSIONS (g/km) e.g. 182 --> low --> 0

3. Pre-Processing
a. Data Exploration

b. Data Visualization


c. Creation of training and testing datasets

d. Normalizing or scaling the dataset

4. Modeling Data (Machine Learning)
- Support Vector Regression

2. Decision Tree Regression

3. Random Forest Regression

5. Model Evaluation
The actual value and the predicted value can be compared to calculate the accuracy of the regression model. Evaluation metrics are very important for model development because they provide knowledge for model improvement.
There are various metrics for model evaluation, for example MSE as an error to determine the accuracy of the built model calculated from the model MSE against the test data:
- Mean Absolute Error (MAE): The average of the absolute values of the errors. MAE is the easiest metric to understand because it is just the average of the errors.
- Mean Squared Error (MSE): is the average of the squared errors. MSE is more popular than MAE because it focuses on large errors because they are squared so that they have a greater impact on larger errors than smaller errors.
- R-squared is not an error but a popular metric that represents the extent to which the data fits the obtained regression line. The larger the R-squared, the better the line fits to the data. The best value is 1.0 and can be negative.
- Support Vector Regression

2. Decision Tree Regression

3. Random Forest Regression

6. Conclusion
From the evaluation results it is stated that the best model that can be used is the decision tree regression model.
Model | MAE | MSE | R2-SCORE |
| Support Vector Regression | 23,31 | 947,03 | 0,69 |
| Decision Tree Regression | 20,52 | 722,69 | 0,78 |
| Random Forest Regression | 20,60 | 724,58 | 0,78 |
Informasi Course Terkait
Kategori: Data Science / Big DataCourse: Riset Kecerdasan Artifisial (SIB AI-RESEARCH)


