
Automobile Hyperparameter Tuning Using G-Collab
Lia Sari Oktara


Summary
This project focuses on automobile hyperparameter tuning using Google Colab, leveraging the Automobile dataset from the UCI Machine Learning Repository. The initial phase involves data preprocessing, a critical step to prepare the raw data for model training.
The preprocessing pipeline begins with addressing missing values. This involves identifying and handling any absent data points within the dataset to ensure data integrity and prevent errors in subsequent analyses. Following this, the process moves to the selection of independent and dependent variables. From the various attributes available in the Automobile dataset, we will specifically identify and isolate two independent variables and one dependent variable. These chosen variables will form the core input and output for our hyperparameter tuning experiments, laying the foundation for building and optimizing our machine learning models.
Following data preprocessing, the next crucial phase involves modelling and performance evaluation. This stage begins with selecting appropriate machine learning algorithms for our task. Given the nature of the Automobile dataset and the goal of predicting a dependent variable based on two independent variables, common regression or classification models (depending on the target variable's type) will be considered.
Once a model is chosen, it will be trained using the pre-processed data. After training, the model's performance will be rigorously evaluated using a set of relevant metrics. For regression tasks, metrics like Mean Absolute Error (MAE), Mean Squared Error (MSE), or R-squared might be used.
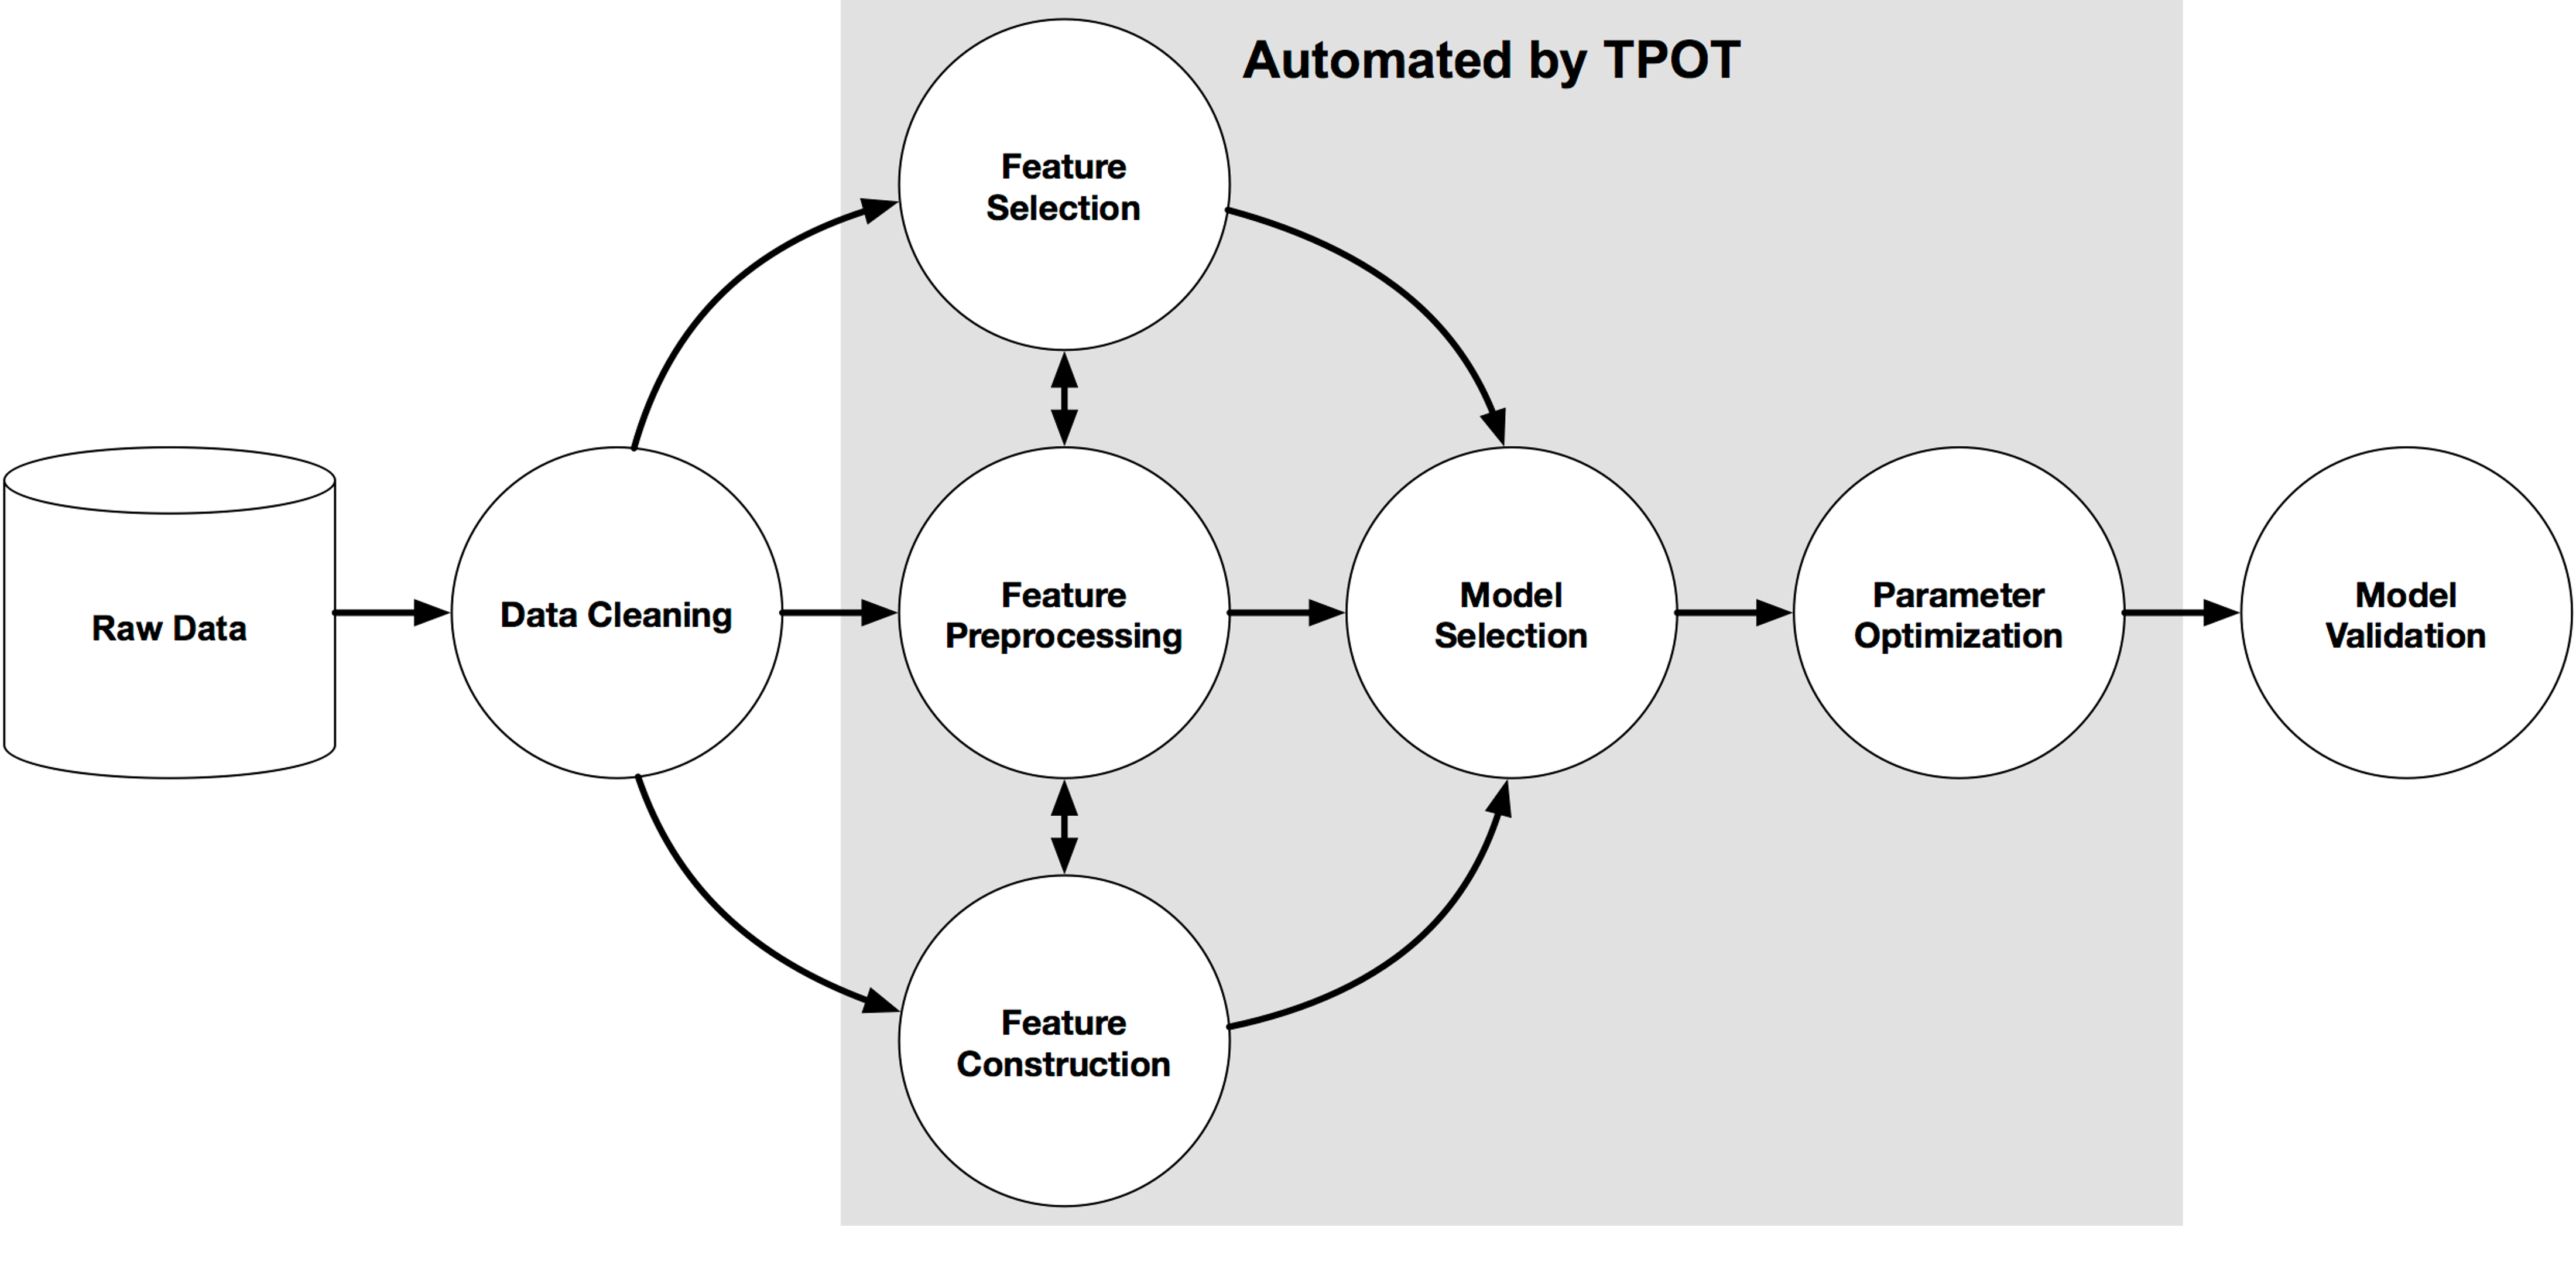
The final and often most impactful stage is hyperparameter tuning. While a model's parameters are learned during training, its hyperparameters are set before training and significantly influence the model's performance. These include learning rate, number of hidden layers, regularization strength, and more, depending on the chosen algorithm.
In this phase, we will employ various optimization techniques—such as Grid Search, Random Search, or more advanced methods like Bayesian Optimization—to systematically search for the optimal combination of hyperparameters. The goal is to maximize the model's performance metrics (identified during the evaluation phase) and minimize errors. This iterative process of adjusting hyperparameters, retraining the model, and re-evaluating its performance aims to identify the best-performing modelling method for our Automobile dataset, ultimately leading to a robust and accurate predictive model.
Description

Data Preprocessing
Connect dataset downloaded from UCI website to Google Drive.

Read csv from file.

Define heatmap analysis to get correlation between variables.

From the heatmap, correlation generates Highway MPG and Engine Size as independent variables. While price is a dependent variable.
As we have defined independent and dependent variables, we start to analyze the data using pre-processed data as baseline. We start with reading the csv file.

We split data into 70% data train and 30% data test.

We use linier regression to model the dataset. Evaluation measurement is as follow:


Enhance the regression model, visualize its performance, and evaluate it using MSE, RMSE, and R-squared.

Experiment with other regression algorithms (e.g., Ridge, Lasso, ElasticNet, Decision Tree Regressor, Random Forest Regressor, Gradient Boosting Regressor) to see if they yield better results.

Optimize the hyperparameters of the chosen model(s) to improve performance.


Re-evaluate the enhanced model(s) using the test set and compare the performance metrics (MSE, RMSE, R-squared) to the initial Linear Regression model.

Examine the residuals (the differences between actual and predicted values) to identify patterns or issues that the model is not capturing.

Implement cross-validation to get a more robust estimate of the model's performance and ensure it generalizes well to unseen data.

Data Analysis Key Findings
- Feature engineering by creating an interaction term (ENGINE_x_HIGHWAY) and polynomial features (degree 2) for 'ENGINE SIZE' and 'HIGHWAY MPG' was performed.
- Experimenting with different regression models showed that tree-based models (Decision Tree, Random Forest, Gradient Boosting) significantly outperformed linear models (Ridge, Lasso), with Gradient Boosting and Decision Tree Regressor having the best initial performance metrics.
- Hyperparameter tuning using GridSearchCV was applied to the Gradient Boosting and Decision Tree regressors. The best parameters for Gradient Boosting Regressor were {'learning_rate': 0.01, 'max_depth': 4, 'min_samples_leaf': 1, 'min_samples_split': 2, 'n_estimators': 300} (training R2: 0.821), and for Decision Tree Regressor were {'max_depth': 10, 'max_features': 'sqrt', 'min_samples_leaf': 1, 'min_samples_split': 2} (training R2: 0.827).
- Evaluating the tuned models on the test set showed that the tuned Decision Tree Regressor had the best performance (MSE: 7,756,784.08, RMSE: 2,785.10, R2: 0.92), followed by the tuned Gradient Boosting Regressor (MSE: 8,667,450.25, RMSE: 2,944.05, R2: 0.91). Both tuned models significantly outperformed the initial Linear Regression model.
- Analysis of the residuals for the tuned Decision Tree Regressor was conducted through a scatter plot of predicted values vs. residuals and a histogram of residuals.
- Cross-validation (5-fold) on the tuned Decision Tree Regressor using the entire dataset resulted in a mean R-squared score of 0.25 and a standard deviation of 0.91, including a significantly negative score in one fold, indicating poor generalization and instability.
Insights or Next Steps
- Despite strong performance on the test set after tuning, the poor cross-validation results suggest potential overfitting of the tuned Decision Tree model to the specific train-test split used. Further investigation into the data distribution and potential outliers is needed.
- Consider techniques to improve the generalization of the Decision Tree model, such as exploring different max_features settings, or trying other regularization methods. Alternatively, re-evaluating the Gradient Boosting model with more extensive hyperparameter tuning might yield better generalization.
Informasi Course Terkait
Kategori: Data Science / Big DataCourse: Persiapan Sertifikasi Internasional DEBIZ (Data Ethic for Business Professionals)


