
House Price Prediction with a Data Ethics Lens
Agitha Suci Rachmawardani


Summary
This portfolio explores how house prices are influenced by various factors using correlation and regression analysis. More than just building a predictive model, the project highlights the importance of data ethics — including fairness, transparency, privacy, and avoiding bias. It’s a reminder that good data science isn’t just about making accurate predictions, but also about using data responsibly The task is to predict the house price in this area based on several features, which are described below.Before building any models, we explored the dataset to understand variable distributions, detect anomalies, and identify potential features that may influence housing prices. This initial step is essential for both model accuracy and ethical data handling.
Description
House Price Prediction with a Data Ethics Lens
This portfolio explores how house prices are influenced by various factors using correlation and regression analysis. More than just building a predictive model, the project highlights the importance of data ethics — including fairness, transparency, privacy, and avoiding bias. It’s a reminder that good data science isn’t just about making accurate predictions, but also about using data responsibly
This dataset, sourced from Kaggle (https://www.kaggle.com/dataset) , This is a real dataset of house prices sold in Seattle, Washing, USA between August and December 2022. The task is to predict the house price in this area based on several features, which are described below.Before building any models, we explored the dataset to understand variable distributions, detect anomalies, and identify potential features that may influence housing prices. This initial step is essential for both model accuracy and ethical data handling.
The following steps are :
Upload the file to Google Drive

Data Preparation

Cleaning the data : To ensure the dataset is suitable for analysis, a three-step data cleaning process was performed : a) Removing Columns with Excessive Missing Value : Any column containing more than 50% missing values was dropped. This threshold helps maintain data quality by eliminating features that may not provide reliable information due to excessive gaps; b) Imputing Missing Numeric Values : For all numeric columns, missing values were filled with the median of each respective column. Median imputation is robust to outliers and ensures that the central tendency of the data is preserved without skewing distributions, and c) Imputing Missing Categorical Values : For categorical (object-type) columns, missing values were filled with the mode—i.e., the most frequently occurring value in each column. This approach maintains the dominant category within each feature and helps preserve the overall data structure.
Basic Exploratory Data Analysis
Data Analysis : To explore the relationships and patterns within the dataset, a series of analytical steps were conducted focusing on the numerical features: a) Identification of Numerical Columns : The dataset was first examined to isolate numerical columns—those containing continuous or discrete numerical data., b) Scatter Plot Matrix (Pairwise Correlation) : A scatter plot matrix was generated to visualize the pairwise relationships among the numerical variables; c) Correlation Heatmap : A correlation matrix was calculated and visualized using a heatmap to quantify the strength and direction of relationships between each pair of numerical variables. The heatmap uses color gradients to easily highlight strong positive or negative correlations.
Visualization and the result of housing data analysis
Numerical Colums


- Beds : The distribution appears to be somewhat right-skewed, with the majority of properties having 2 to 4 bedrooms. There are fewer properties with a higher number of bedrooms.
- Baths: Similar to beds, the distribution of bathrooms is also right-skewed, with a peak around 2 bathrooms.
- Size: The distribution of property size is also right-skewed, indicating that most properties fall within a smaller size range, with fewer properties being very large. There might be some outliers on the higher end.
- Zip_code: The distribution of zip_code shows multiple peaks, indicating that there are certain zip codes that appear more frequently in the dataset than others. This is expected as the dataset likely covers specific areas with varying population densities.
- Lot-size: The histogram for lot_size shows a highly right-skewed distribution. A large number of properties have smaller lot sizes, and there are some properties with significantly larger lots, which appear as a long tail on the right. This suggests that the median might be a more representative measure of central tendency than the mean for this feature due to the presence of outliers. Price: The distribution of price is also right-skewed, with most properties being in the lower to mid-price range and fewer properties at very high prices. This is a common pattern in real estate data.
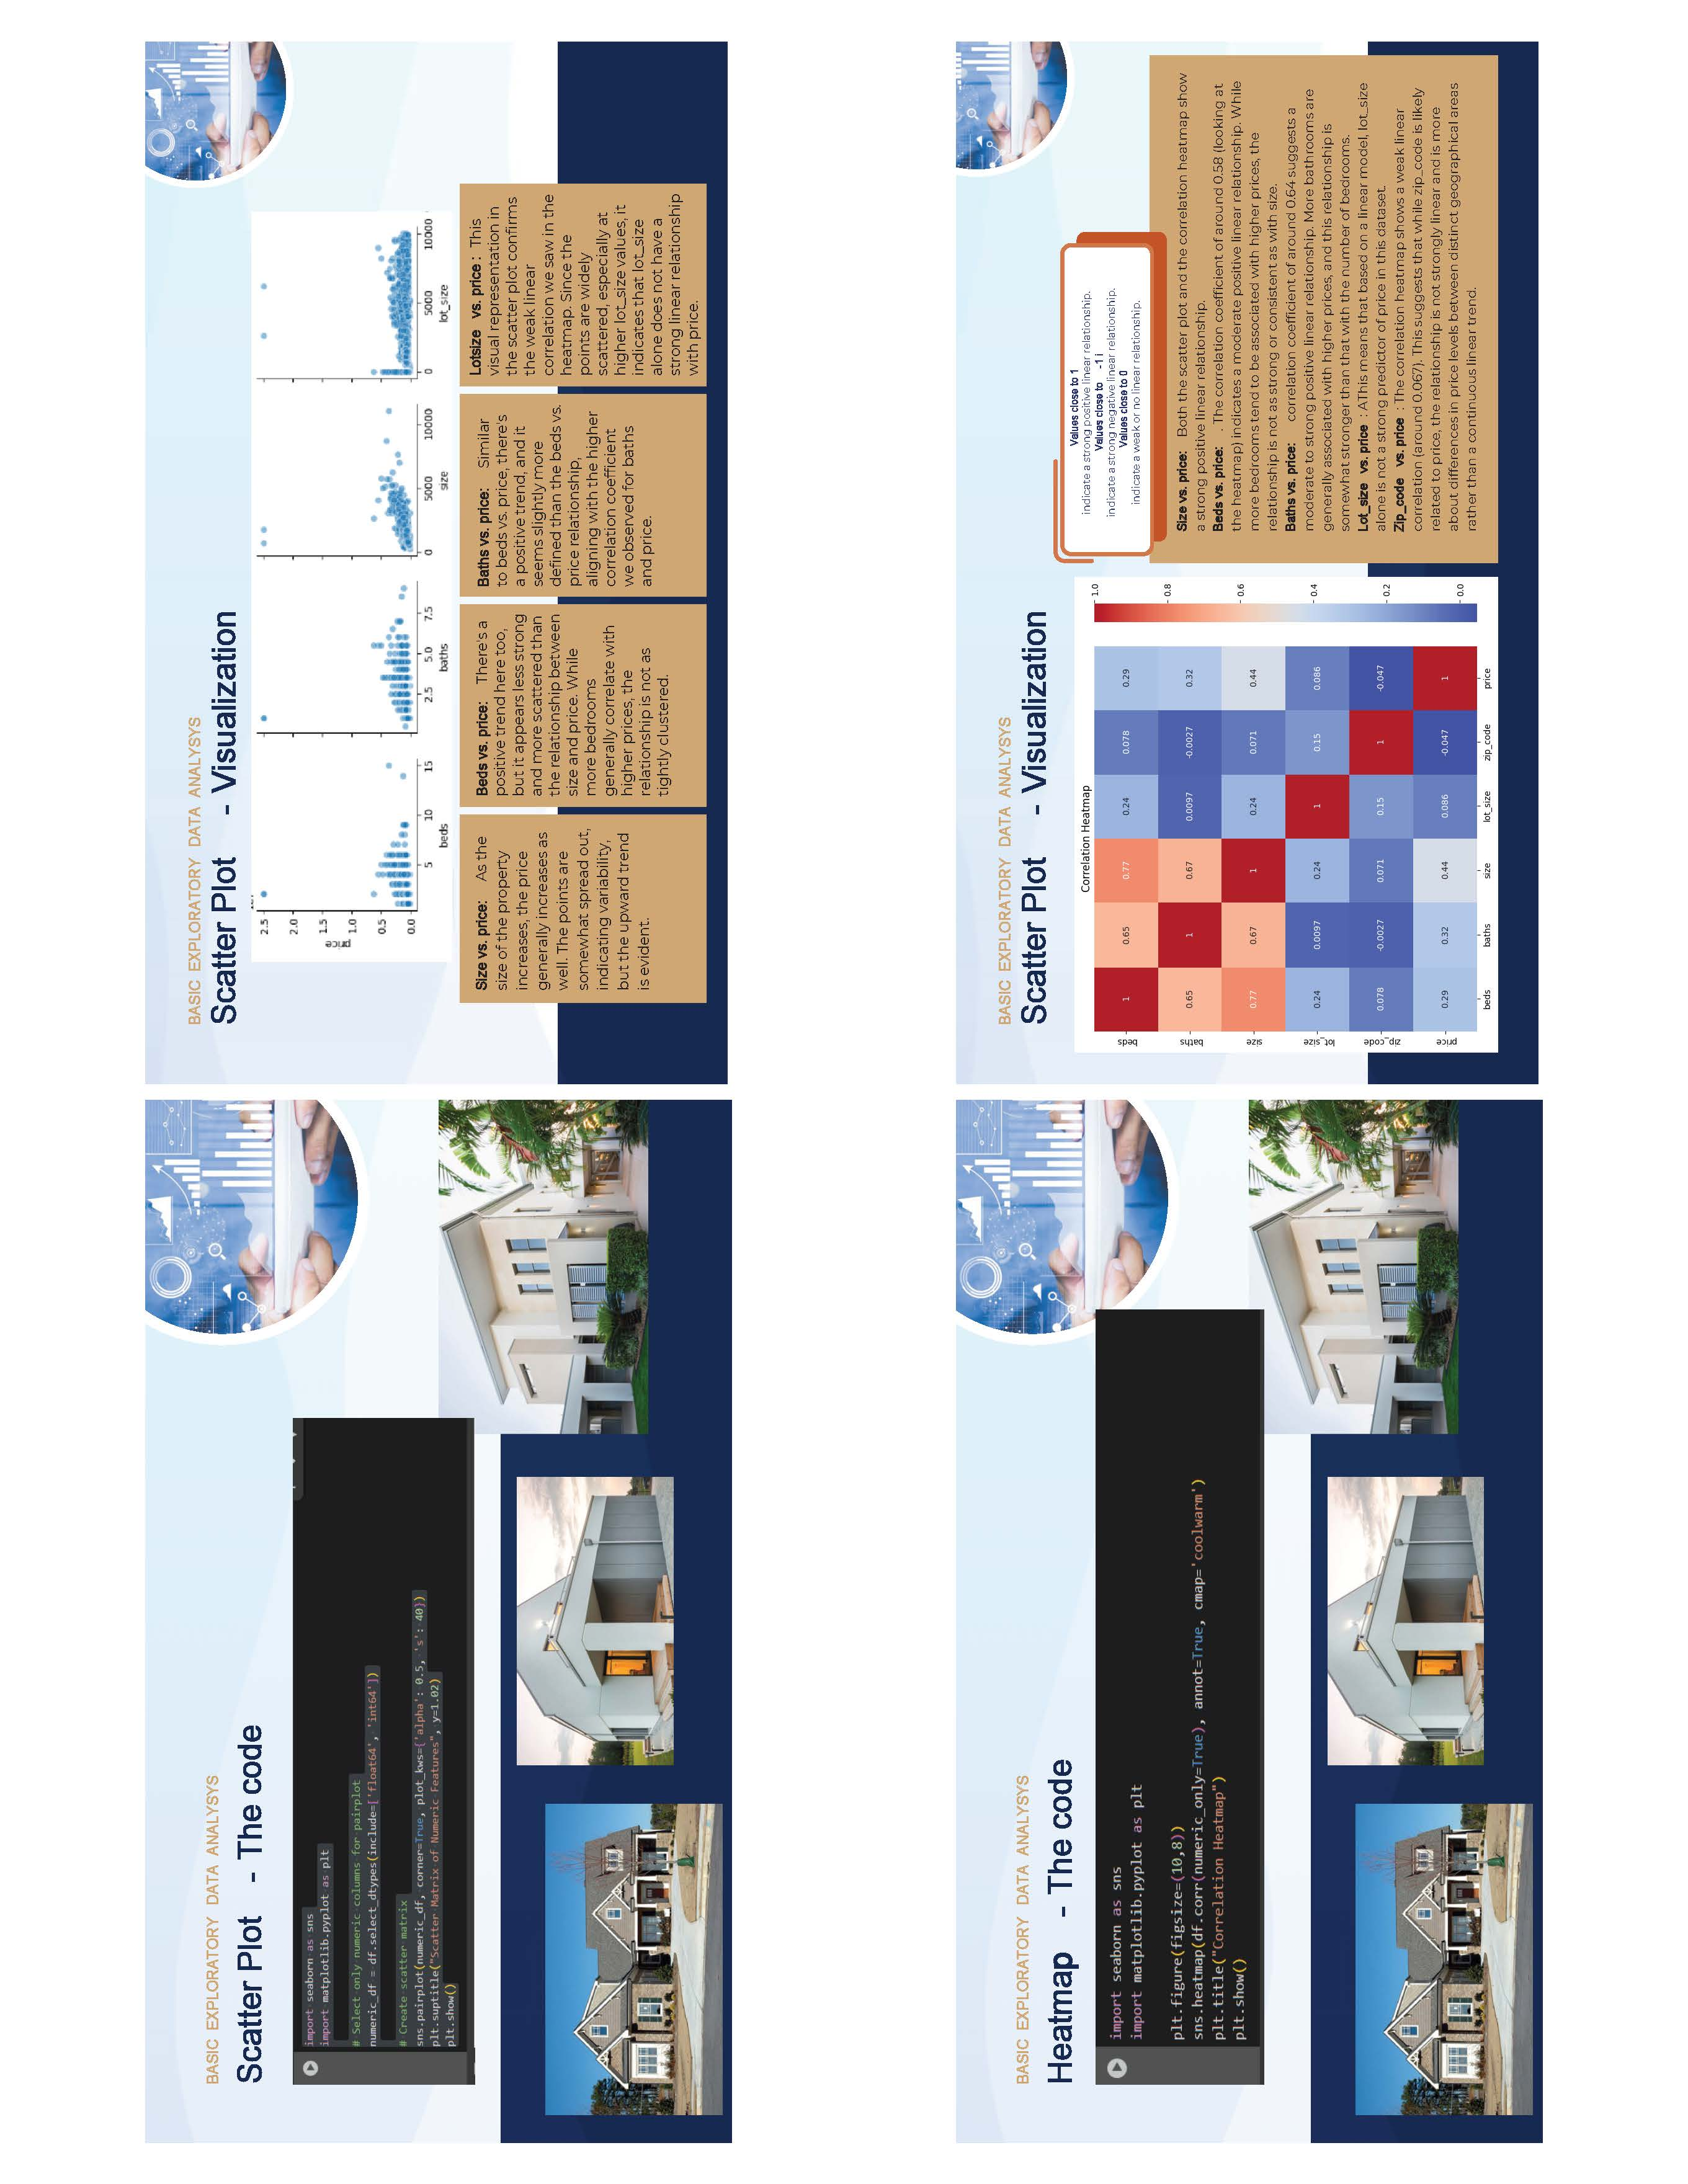
Scatter Plot


- Size vs. price: As the size of the property increases, the price generally increases as well. The points are somewhat spread out, indicating variability, but the upward trend is evident.
- Beds vs. price: There's a positive trend here too, but it appears less strong and more scattered than the relationship between size and price. While more bedrooms generally correlate with higher prices, the relationship is not as tightly clustered.
- Baths vs. price: Similar to beds vs. price, there's a positive trend, and it seems slightly more defined than the beds vs. price relationship, aligning with the higher correlation coefficient we observed for baths and price.
- Lotsize vs. price :This visual representation in the scatter plot confirms the weak linear correlation we saw in the heatmap. Since the points are widely scattered, especially at higher lot_size values, it indicates that lot_size alone does not have a strong linear relationship with price.
Heatmap

Values close to 1 indicate a strong positive linear relationship; Values close to -1 indicate a strong negative linear relationship, and Values close to 0 indicate a weak or no linear relationship.
- Size vs. price: Both the scatter plot and the correlation heatmap show a strong positive linear relationship.
- Beds vs. price: . The correlation coefficient of around 0.58 (looking at the heatmap) indicates a moderate positive linear relationship. While more bedrooms tend to be associated with higher prices, the relationship is not as strong or consistent as with size.
- Baths vs. price: correlation coefficient of around 0.64 suggests a moderate to strong positive linear relationship. More bathrooms are generally associated with higher prices, and this relationship is somewhat stronger than that with the number of bedrooms.
- Lot_size vs. price: AThis means that based on a linear model, lot_size alone is not a strong predictor of price in this dataset.
- Zip_code vs. price: The correlation heatmap shows a weak linear correlation (around 0.067). This suggests that while zip_code is likely related to price, the relationship is not strongly linear and is more about differences in price levels between distinct geographical areas rather than a continuous linear trend.
This portfolio integrates data ethics at every stage of the analysis process:
Responsible Data Cleaning
Columns with excessive missing values were removed, and missing numeric and categorical values were imputed using median and mode respectively—preserving data integrity and minimizing bias.
Fair Feature Selection
Features were selected based on actual correlation, not assumptions. Weakly correlated features like lot_size and zip_code were acknowledged but not overemphasized, ensuring fairness and objectivity.
Transparent Interpretation
Visualizations like scatter plots and heatmaps were used to communicate relationships without overstating causality, promoting clarity and avoiding misleading conclusions.
Bias Awareness
The influence of location (zip_code) was interpreted cautiously to avoid reinforcing geographic or socioeconomic bias in the model.
Ethical Model Evaluation
Beyond accuracy metrics, the model was evaluated in terms of relevance, fairness, and the real-world meaning of its predictions—aligning with responsible data use.
The analysis revealed that house price is most strongly correlated with property size, followed by the number of bathrooms and bedrooms. While lot size and zip code show weaker correlations, they may still hold contextual value. These insights highlight how key physical features impact property value—and remind us that understanding correlation is essential before building any predictive model.
Informasi Course Terkait
Kategori: Data Science / Big DataCourse: Persiapan Sertifikasi Internasional DEBIZ (Data Ethic for Business Professionals)


