
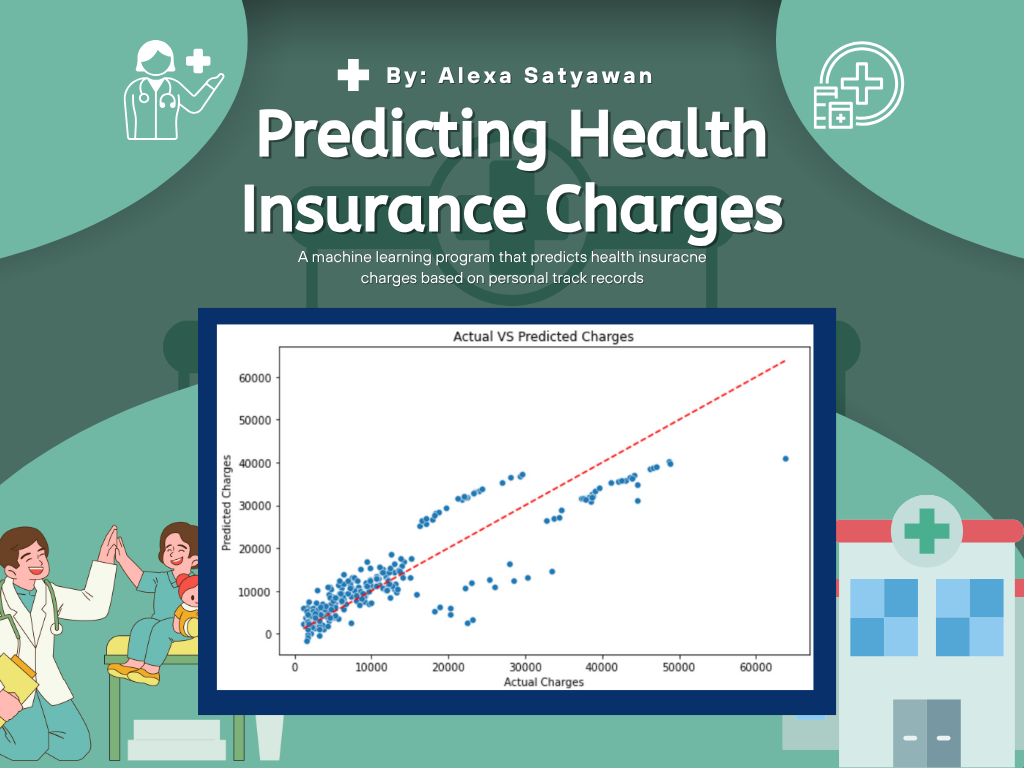
Predicting Health Insurance Charges - ML
Alexa Satyawan
Summary
Leveraged machine learning to create a program that can predict health insurance charges based on personal track records. Utilized Pandas to process big data, Scikitlearn to download models and Matplotlib to illustrate visualizations. Health services are experiencing an exponential rise. Affecting everyone, making it unavailable and challenging for many to access, and driving a poverty trap. In the United States, individuals will spend an average of $14,000 on healthcare expenses per year. Insurance systems that don’t use fixed rates, charge some individuals more to maintain their fairness policy. However, many still don’t understand why some individuals become bigger contributors. As a result, transparency and the financial incentives to lead a healthier lifestyle is lost.
Description
Background information
- Health services are experiencing an exponential rise. Affecting everyone, making it unavailable and challenging for many to access, and driving a poverty trap. In the United States, individuals will spend an average of $14,000 on healthcare expenses per year. Insurance systems that don’t use fixed rates, charge some individuals more to maintain their fairness policy. However, many still don’t understand why some individuals become bigger contributors. As a result, transparency and the financial incentives to lead a healthier lifestyle is lost.
Problem Statement
- How do we conduct a regression-based model to predict health insurance charges?
- Would this become an efficient and reliable model to predict an individual's health insurance expenses?
Motivation
- A personalized approach for civilians to increase financial saviness in terms of healthcare expenses. For policy-makers to find incentives to improve healthcare cost prices, making it more reasonable and affordable. To highlight patterns and cases where unhealthy lifestyles caused a subsequent increase in health insurance charges, motivating people to live healthier lifestyles.
Goal Analysis
- Build a healthcare insurance charges prediction system
- Measure a customer satisfaction prediction system. Evaluated through a confusion matrix.
Tools used:
- Laptop
- Jupyter notebook
- Kaggle
- Active internet connection
Steps:
- Data acquisition
Data extracted from Kaggle titled “Medical Cost Personal Datasets”: https://www.kaggle.com/datasets/mirichoi0218/insurance
2. Data preprocessing
- First, I connected the dataset from Kaggle with the program, specifically with the help of Pandas to read the csv file.
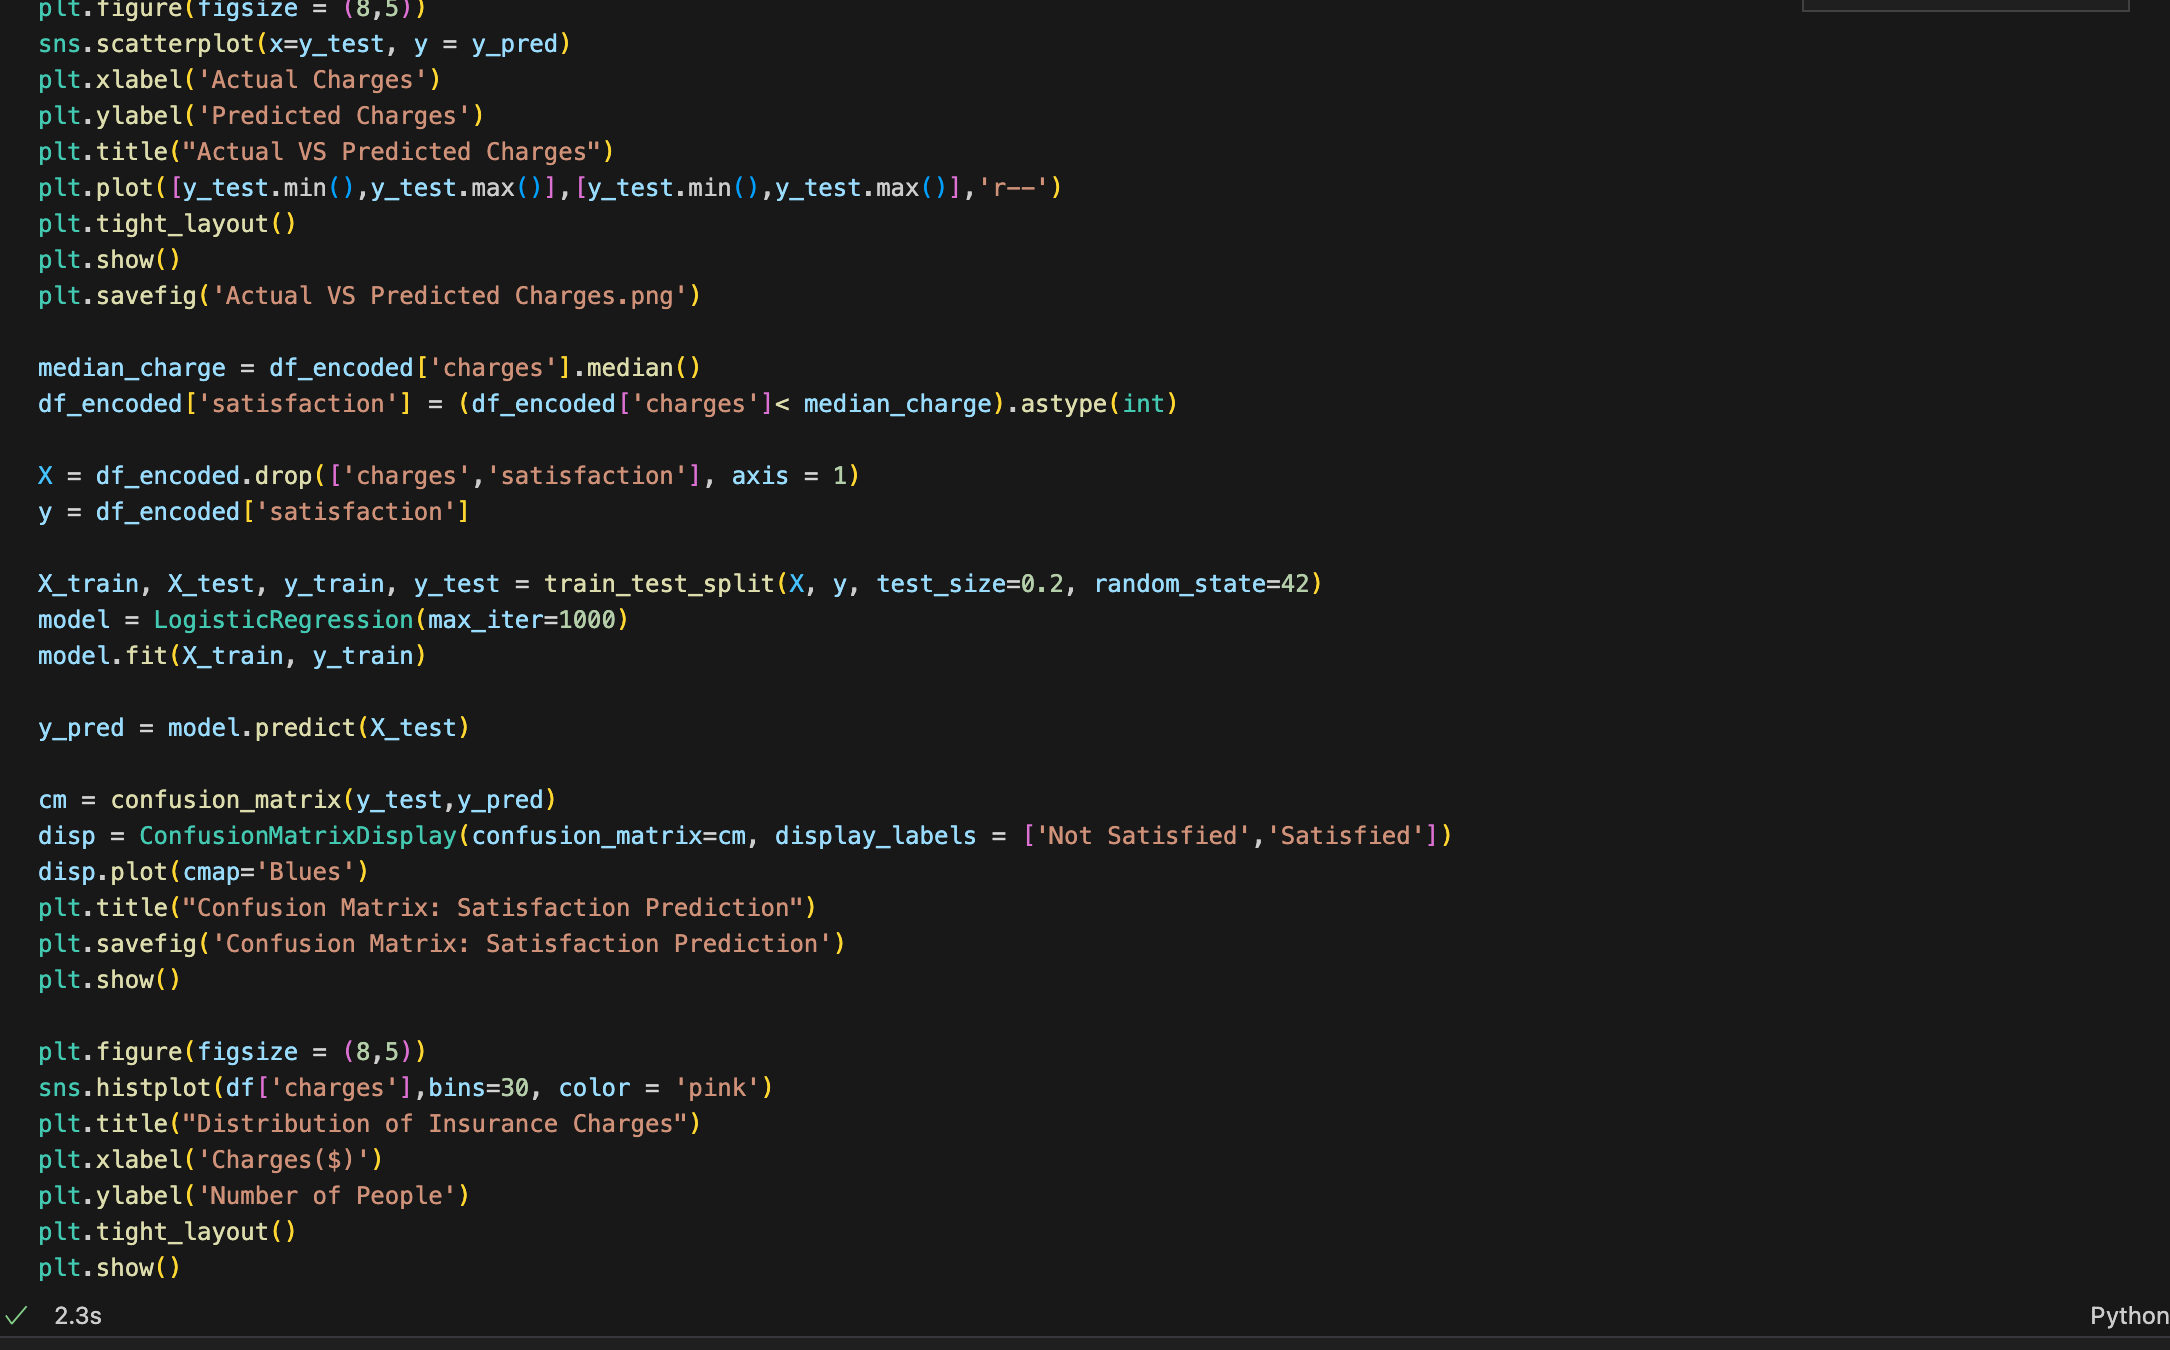
- Then converted many of the category properties to binary form to make it easier and acceptable for the program to convert it into models. I used “df_encoded = pd.get_dummies(df, drop_first = True)”. This changes items like “yes/no” variables into readable numeric form (1 or 0).
- For the scatter plot, I separated the target variables (y) or the health charges column (specified it with axis = 1), with the features (x) which is the personal information of an individual.
3. Modeling
Produced three models for this project for effective visualization:
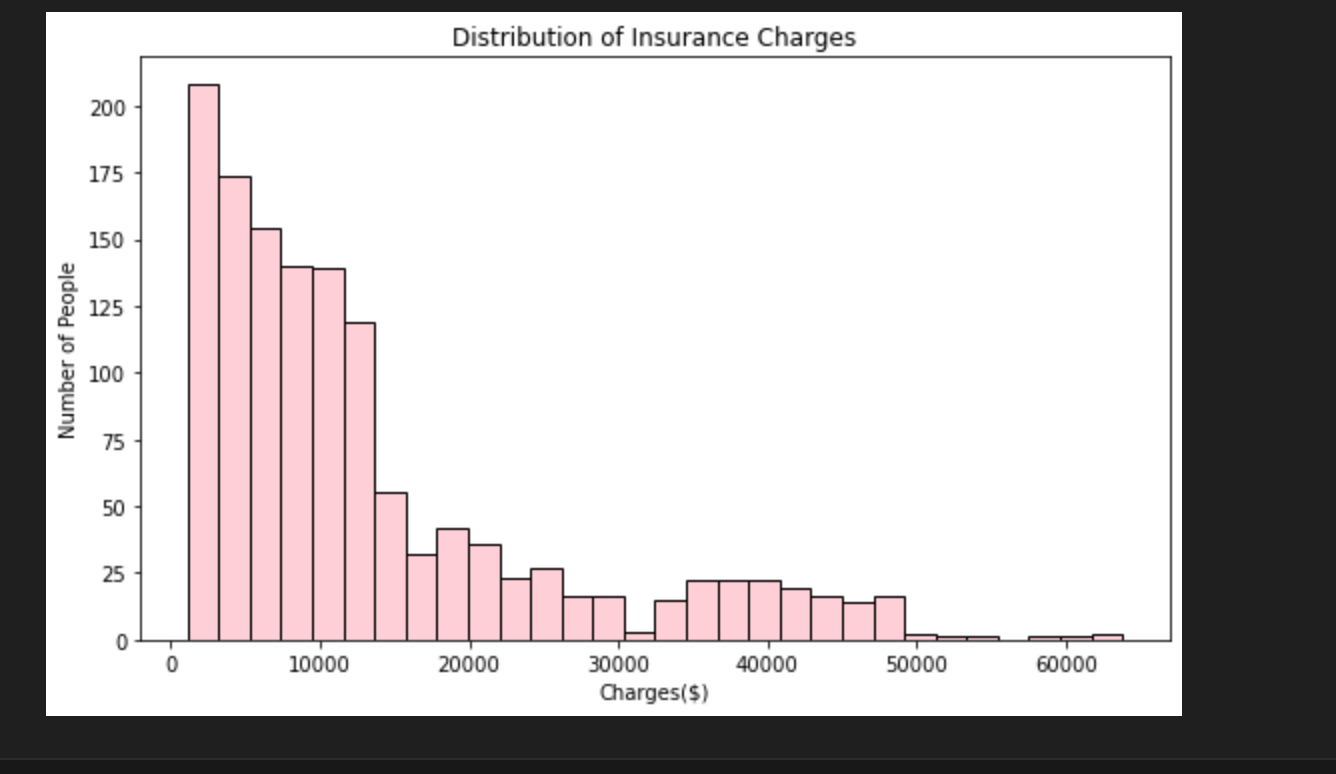
- The simplest one being a histogram to describe the distribution of charges. Created with a combination of seaborn and matplotlib. This graph illustrates the amount of people who get charged a certain amount across bin intervals of 30.
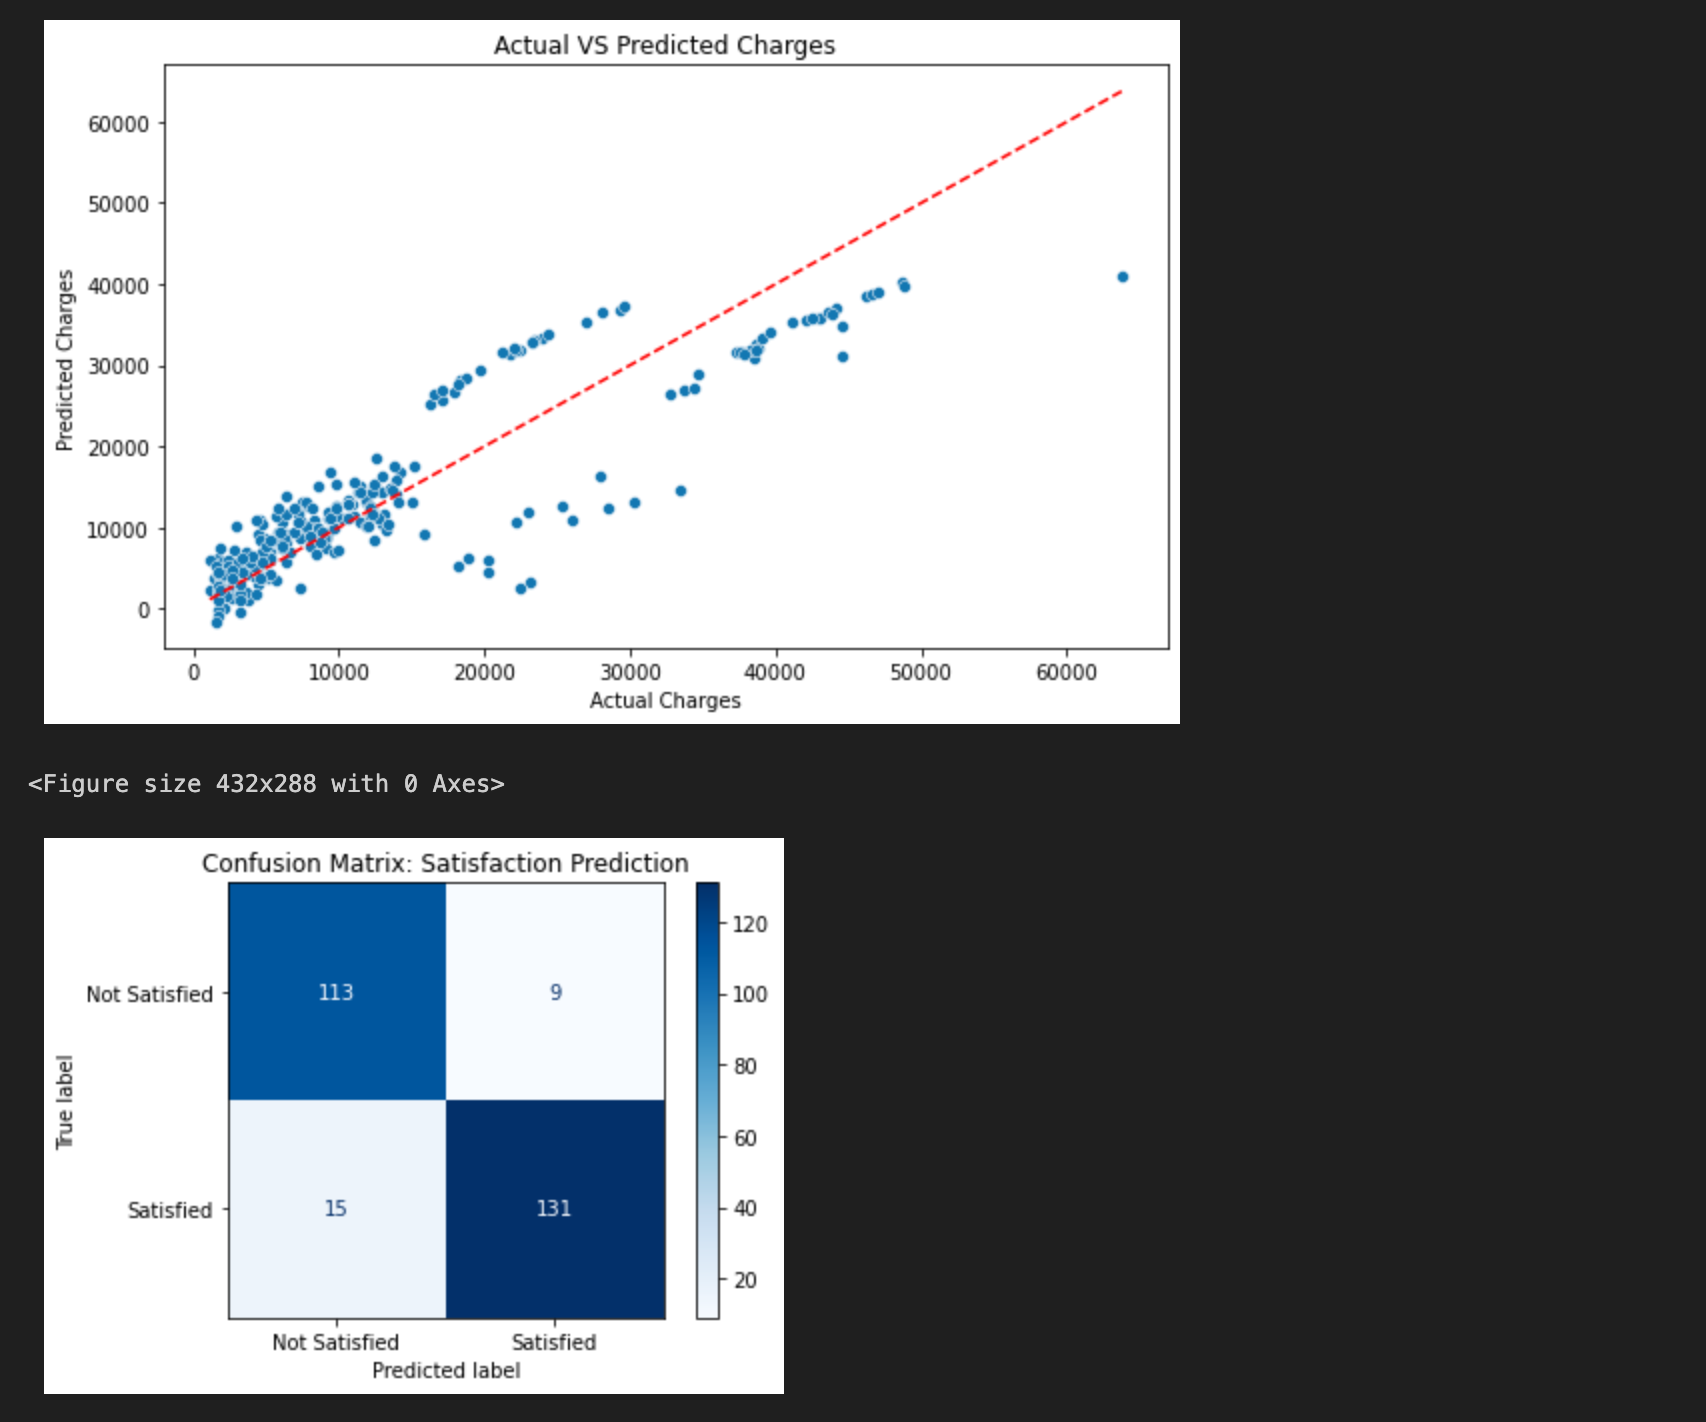
- The next model is a scatter plot that illustrates linear regression. To get this done, I ran a train and test split program to allow only 80% of the existing data to be used for training and the remaining 20% to be used for accuracy testing purposes. It is between the predicted charge (y label) and the actual charge (x label). Based on the graph, it seems that my machine learning algorithm is quite accurate, as the dots tend to cluster around the regression line.
- Lastly, I also created a logistic regression model or a classification system that is visualized with a confusion matrix. In order to do this, I added an additional column where customer satisfaction is graded based on if the charge is under or over the median.
4. Evaluation
Evaluated the model with Mean Absolute Error, Mean Squared Error and R^2 score.
- MAE: 4181.19
- Data interpretation: This means that my program’s predictions are usually off by approximately $4,000. Based on my findings, this doesn't make the algorithm trivial because considering the fluctuations of real-life prices and how high health insurance could go, a couple thousand should not be too significant.
- MSE: 33596915.85
- Data interpretation: Since this is squared, it’s understandable for the values to be higher, accumulating to about 33 million. It places a bigger fault and burden on outliers.
- R2: 0.78 → 78%
- Data interpretation: 78% is a reliable amount. While not exactly 100%, research says that machine learning algorithms with an R2 score above 70% are worthy to be used for research and official purposes.
Informasi Course Terkait
Kategori: Data Science / Big DataCourse: Machine Learning For Beginner


