
Covid 19 Prediction in Indonesia
Patria Ufaira Aprina

Summary
Corona (Covid 19) is a particular illness brought on by a virus that infects the respiratory system and started to spread in 2020. The worldwide spread of the disease has been accompanied by a critical intensity, leading this plague to be classified as a pandemic. The objective of this project is to implement Exploratory Data Analysis (EDA) to identify the growth rate of COVID-19 in Indonesia from January 2021 to September 2022. Covid prediction is also accomplished by the establishment of a machine-learning model using the root square (R2) metric and the decision tree technique. The EDA demonstrates that the overall number of COVID-19 cases is rising each month, with August 2021 and March 2022 showing the highest numbers of new cases and deaths, respectively, while the highest death rate occurring in August 2021. Owing to the correlation study, there is a significant relationship between the growth in the number of total active cases and the number of totals recovered. The R2 value of the covid prediction is 0.74, showing a correlation between the data and the model created.
Description
Introduction
The COVID-19 dataset in Indonesia was established in order to identify several elements that could be considered in decision making regarding the level of stringency in each province in Indonesia. Data that was compiled using time series on both a province and national level (Indonesia). It might also be offered at the municipal or regency level in some regions, if necessary. Calculations combining demographic data with COVID-19 pandemic data are also accessible, as well as statistics on demographics.
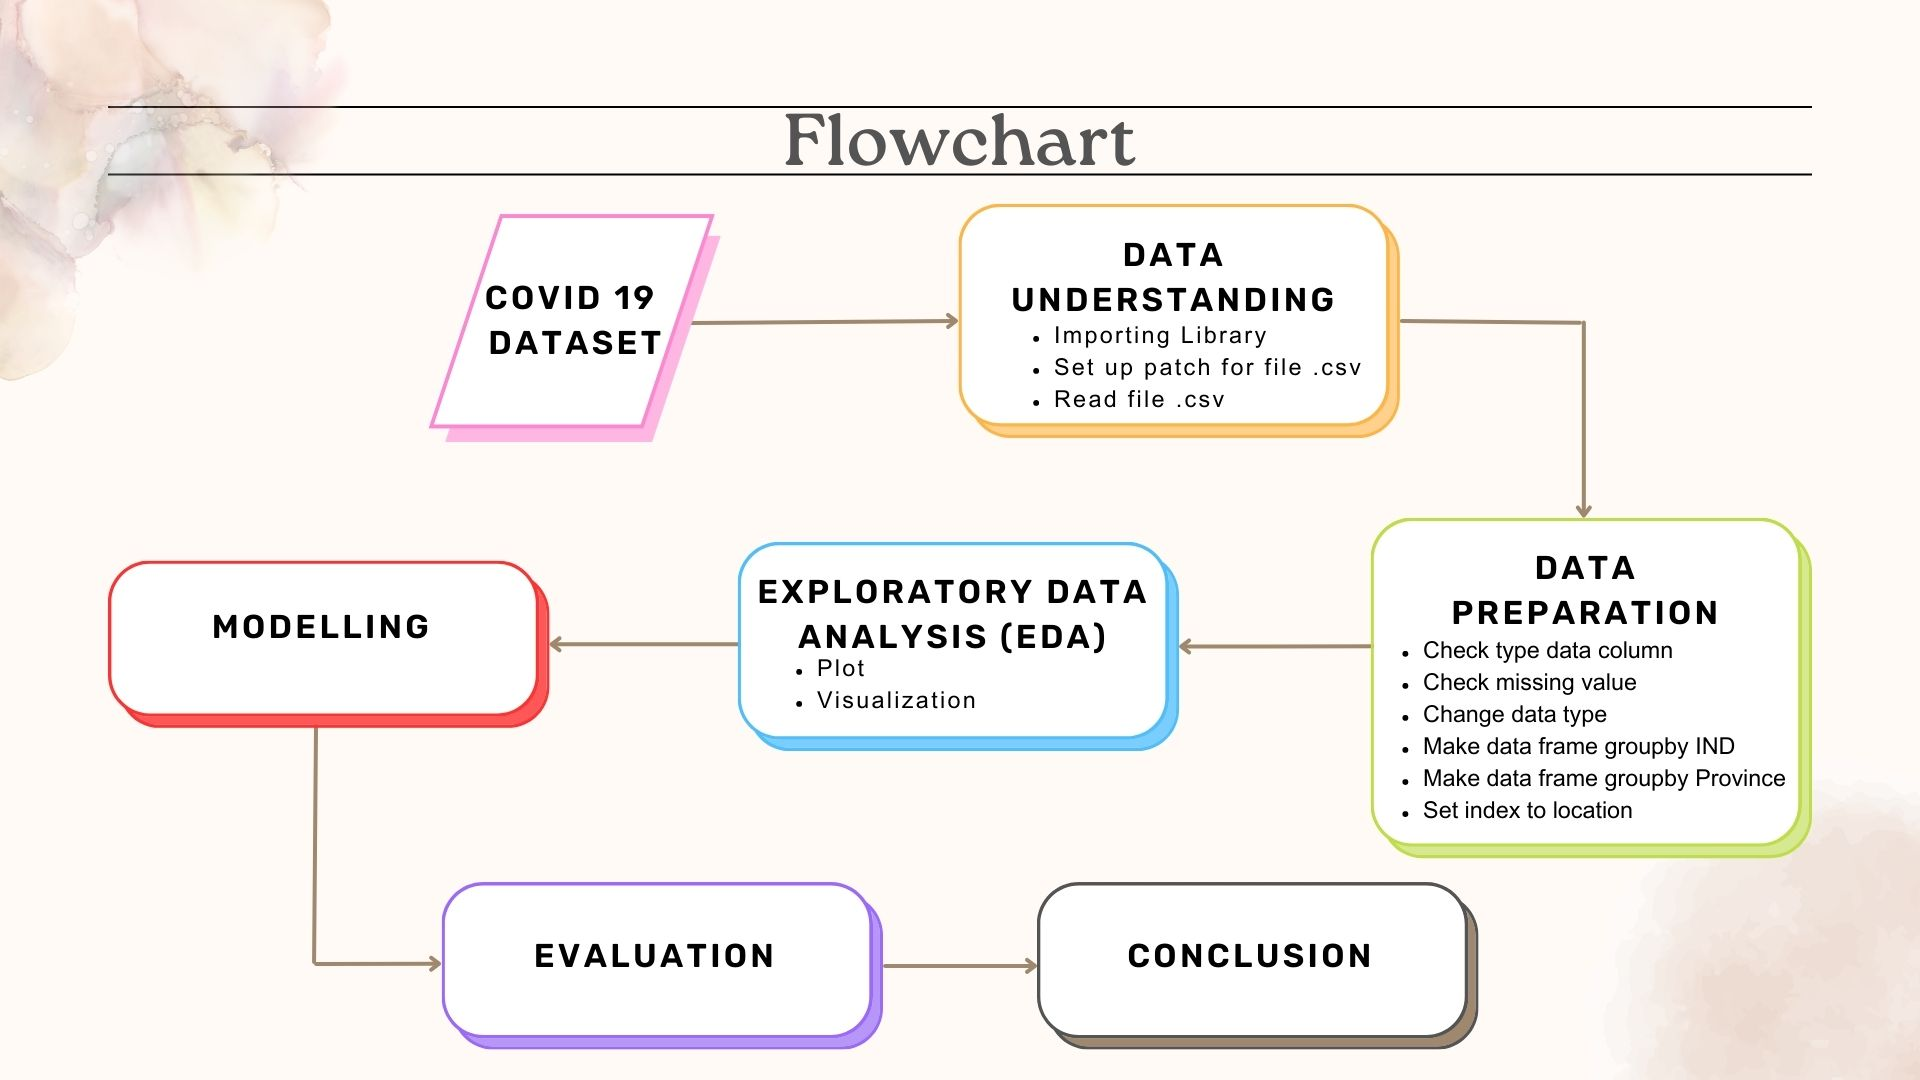
Data Understanding
The first step is opening a jupyter notebook from command (cmd), followed by the setup of a new worksheet. Afterwards, importing library used such as pandas, seaborn, matplotlib and plotly. The model is generated by the sklearn module. Subsequently, use the pandas library to classify and display the top data after storing the dataset in the df variable. Covid 19 data from Indonesia was acquired from https://www.kaggle.com/datasets/hendratno/covid19-indonesia?resource=download


Data Preparation
To create a good model, our database needs to be examined and checked for noise, inconsistent data, and missing values. This set of procedures is known as data preprocessing. Data preparation includes numerous stages such as checking for missing information, updating data types, and eliminating unnecessary columns.
First, we checked the dataset information using one of function in Pandas, info, to demonstrate specific details about the data frame, such as the number of rows of data, column names together with the quantity and type of data, etc.


The dataset information reveals various data types in each column, including objects, integers, and floats. Afterward, we checked for empty values in each data using the pandas' package to verify if our dataset contains empty data as shown in the script below:

Date column has object data type based on column data information. As a result, it must be transformed to a datetime type.

The next step is to eliminate unused columns by taking into account the number of missing values in the column data. The greater the number of missing values in a column, the less significant the data becomes; hence it must be dropped.

To generate data by province, the code is used as shown below:


Exploratory Data Analysis (EDA)
EDA is utilized as a method in statistical data analysis to understand the features of the dataset to be used. In this project, we use the code presented in the figure below to evaluate data on total cases, total active cases, total fatalities, and recovered from 2020 to 2022 to assess the progress of covid in Indonesia.


According to the data presented above, there has been an enormous rise of Covid instances over the last two years, with the peak occurring in September 2022. Because the total number of cases is inversely related to the total number of recovered, the death rate is low (red line). It indicates that the spread of covid can be controlled effectively. The total number of active cases remained largely steady and experienced significant rises in August 2021 and March 2022.


In addition, an analysis was performed to identify the most recent case developments by utilizing data on new cases, new deaths, and new recovered. The new cases and new recovered data have almost the same trend, with the highest numbers being in August 2021 and March 2022. August 2021 has the highest percentage of new deaths compared to previous periods, similar to new cases and new recovered data. However, there were very few new death cases in March 2022, despite the fact that new cases and new recovered data showed the highest values from 2021 to 2022. This demonstrates that it is possible to manage the COVID-19 in Indonesia.
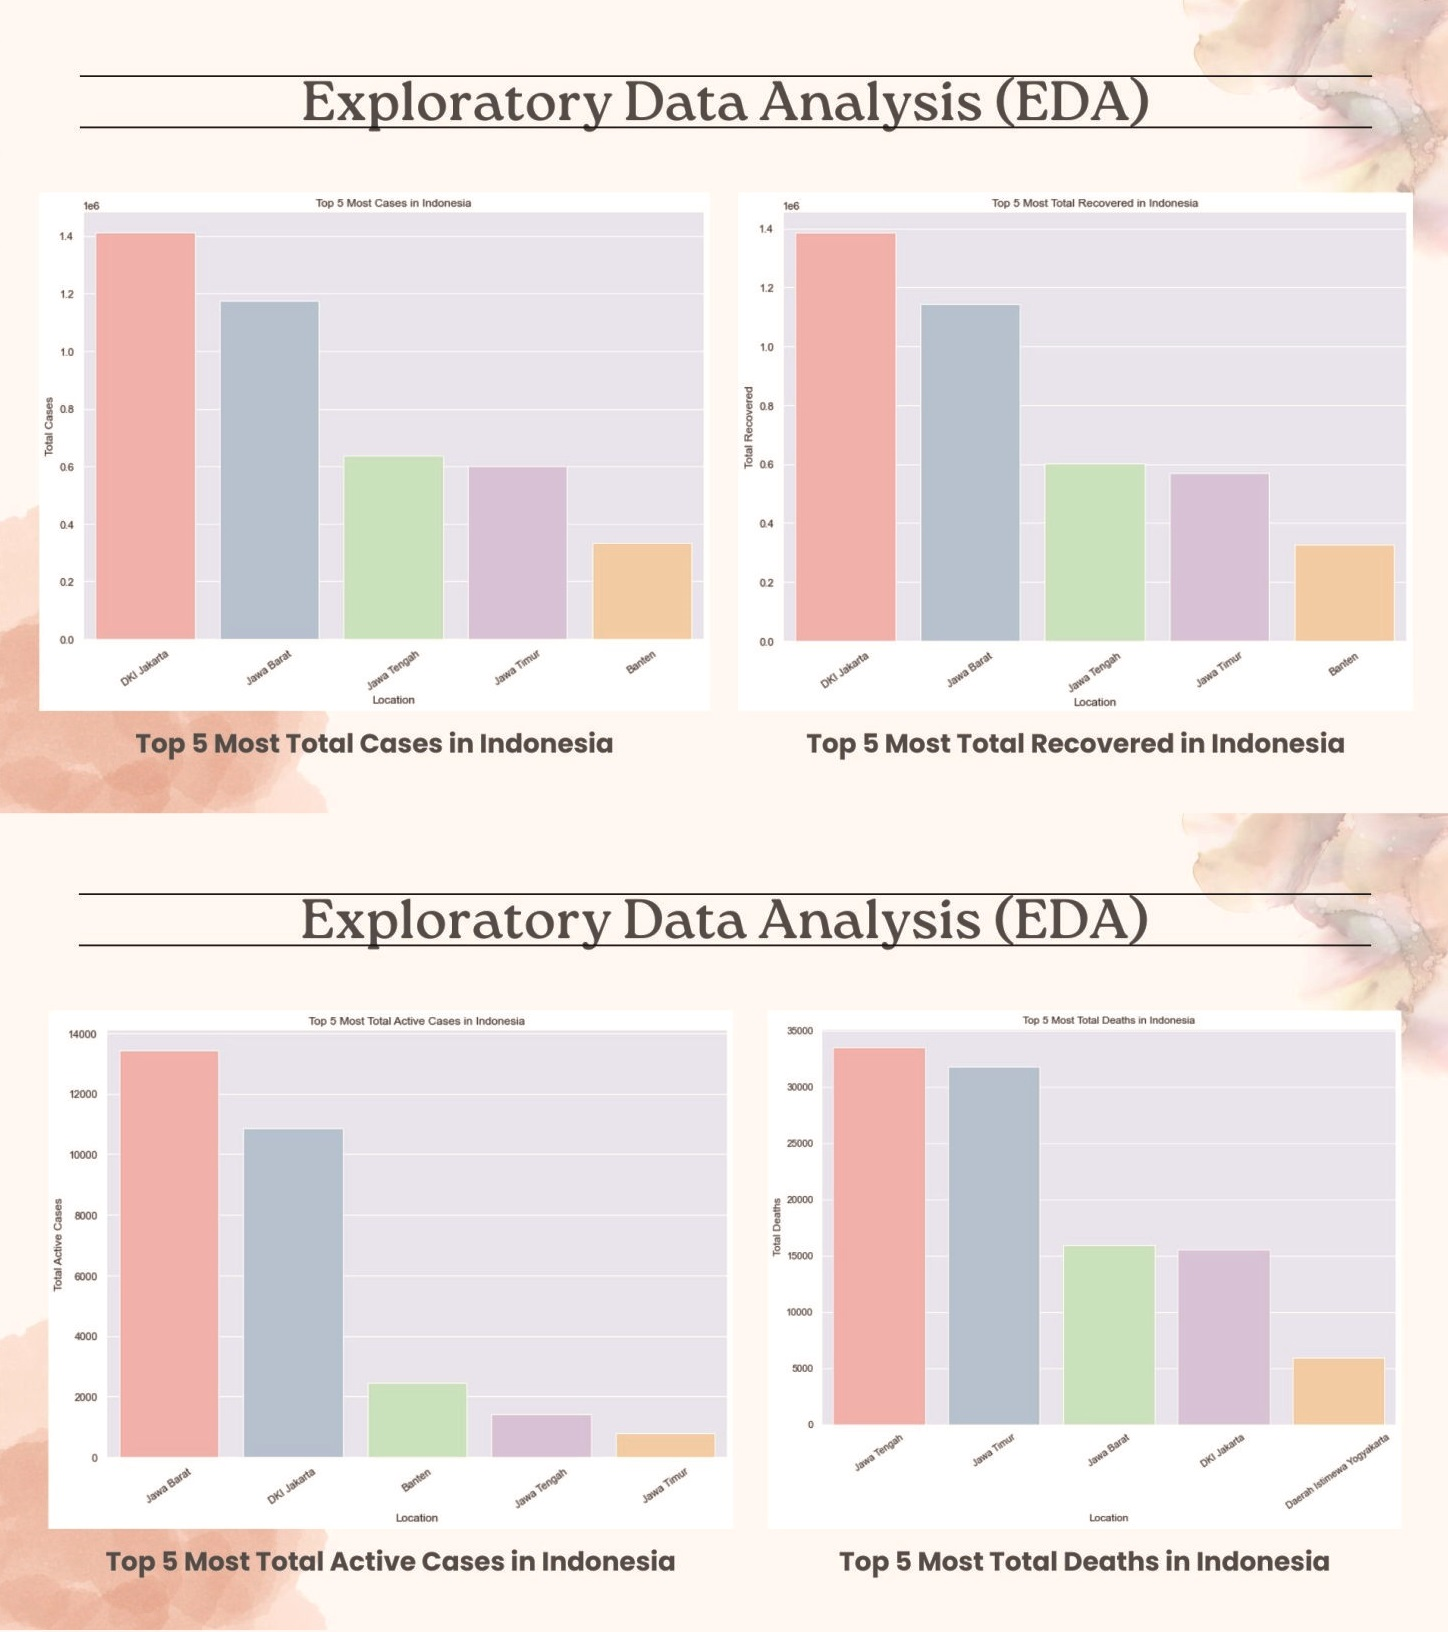
Furthermore, an analysis was carried out on the regions that had the highest total recovered, total deaths, total active cases and total cases. The analysis is illustrated by a bar chart created with the matplotlib and seaborn modules with the code:


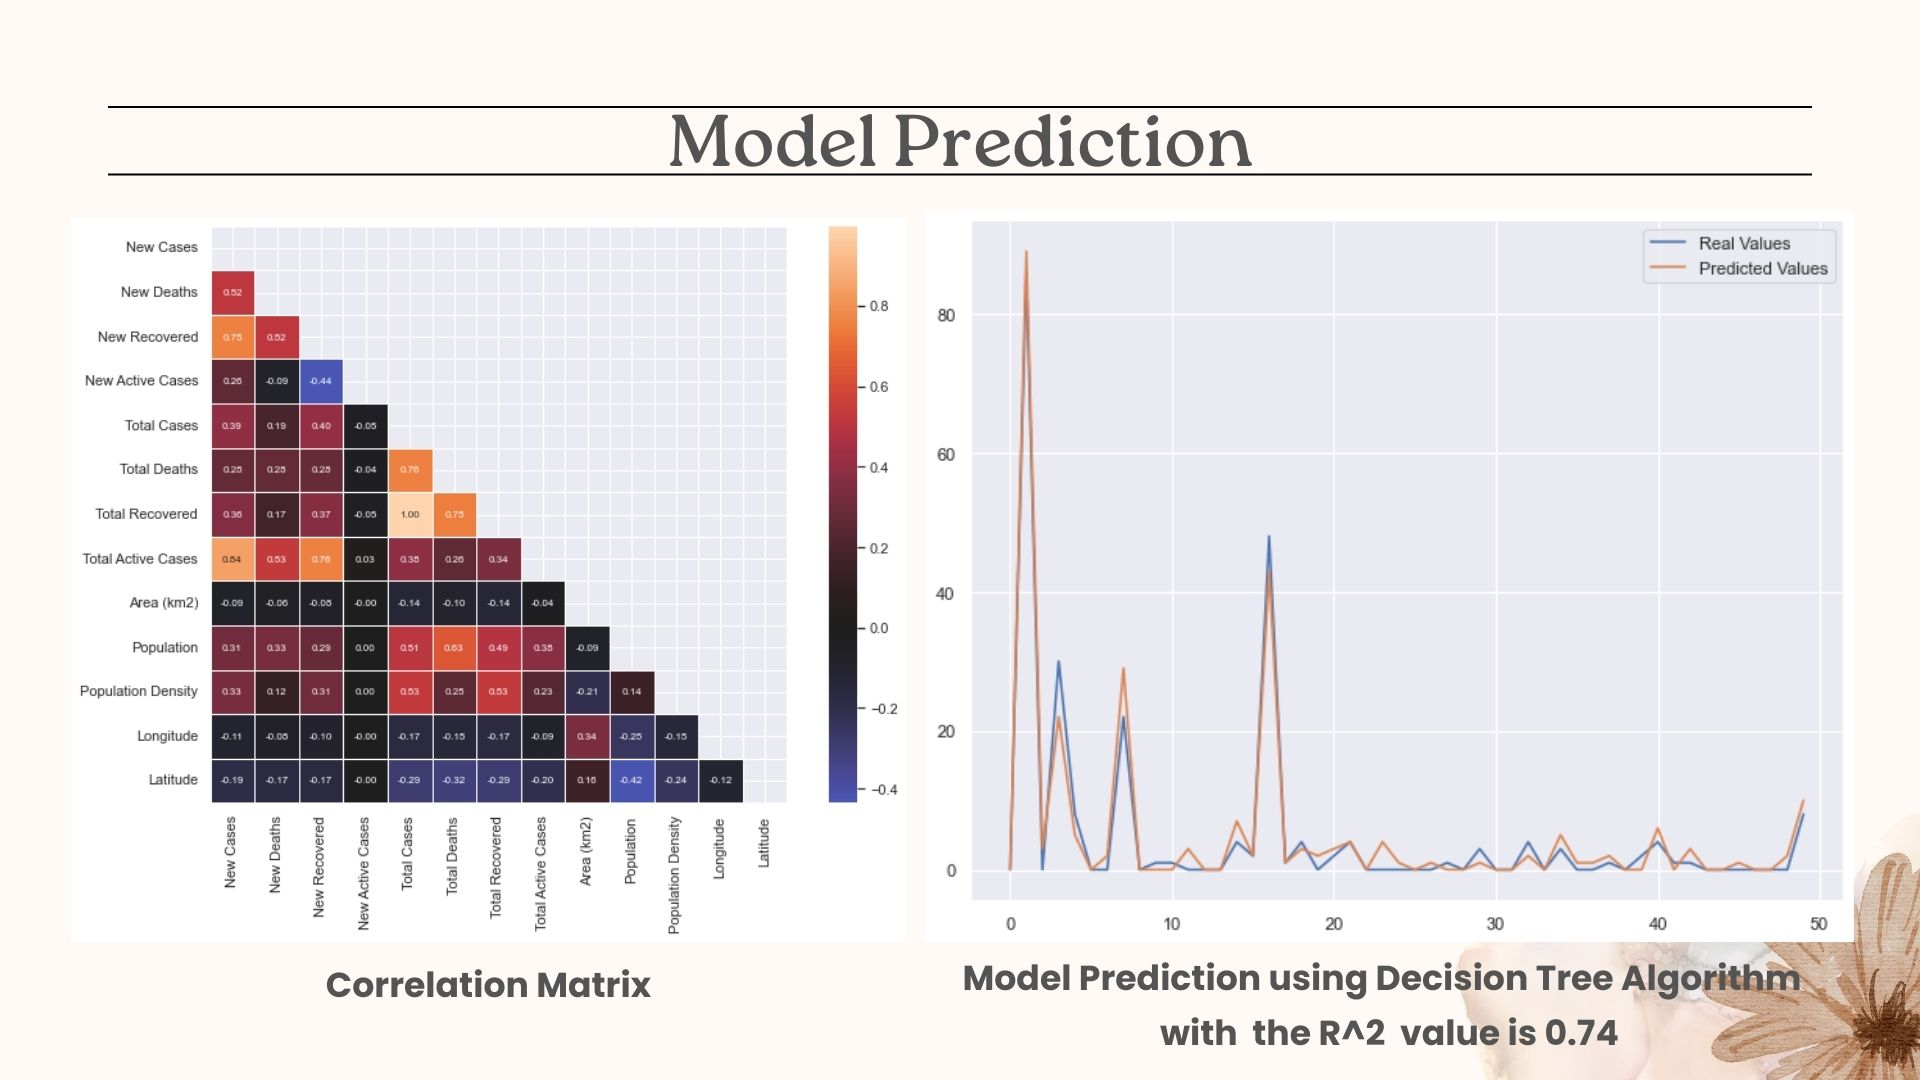
The correlation matrix is used to evaluate the relationship between variables. The initial stage is to use the corr() function to determine correlations between data variables. To see the data in greater detail, we may generate a matrix plot by the heatmap() function based on the correlation values. When the correlation value reaches one, the relationship between features becomes higher.


The data with the highest correlation values (New Recovered, Total Recovered, Total Cases, Total Deaths, Total Active Cases, Population, and Population Density) compared with new deaths will be used.

Split Data
In generating model, the dataset is separated into two parts. The first part is used to evaluate or test the data and the other data is used to train the model. Pipelines are used to identify the greatest combination of data processing and performance by running it through a single stage.

Predict Data
Each machine learning model is attempting to solve a problem with different objectives using various datasets, and consequently, it is important to understand the context before selecting metrics. Metrics try to assess the accuracy of a forecasting model. This project utilizes four metrics: Mean Absolute Error (MAE), Mean Squared Error (MSE), Root Mean Square Error (RMSE), and Root Square (R2). In MAE, MSE, and RMSE, the higher the value, the less representative the model. In contrast to these three criteria, a low R2 value suggests a good model.


From the R2 results, the DecisionTree algorithm is being used to build a model.


The covid 19 prediction model developed by the Decision Tree algorithm has an R2 of 0.74, indicating that the model created has a high fit with the data.
Save Model

Informasi Course Terkait
Kategori: Data Science / Big DataCourse: Master Class Data Science


